




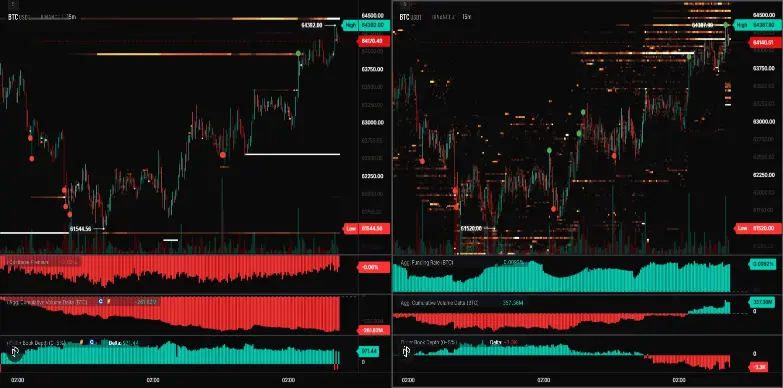
- A steady rise in Bitcoin Perpetual futures CVD highlights strong activity in leveraged markets.
- On Friday, Coinbase Premium remained slightly negative (-0.06%), reflecting muted spot buying demand.
- Analyst IT Tech pointed out a visible difference between the spot market activity and derivatives positioning, indicating a risk of potential liquidity sweep.
On June 10th, the Bitcoin price experienced a notable jump of 1.9% to currently trade at $64,390. The rising price, backed by a 7.53% drop in 24-hour trading volume to $25.53 billion, highlighted a lack of support from spot traders. However, perpetual futures data reveals rising Cumulative Volume Delta (CVD) and positive funding rates that suggest that the surge is from leveraged longs and not spot buyers. These leverage-induced moves are usually weak and may come with a higher risk of a sudden reversal when the market is down.
BTC Price Recovery Could Fade as Spot Demand Stalls
This week, Bitcoin showed several attempts to break below the $61,500 level, but rebounded each time, forming long-wick rejection candles. The buying pressure accelerated in the last 48 hours, and the coin price rebounded from $62,238 to $64,304 for a 3.56% gain.
This uptick triggered roughly $51.79 million in short-liquidation on Thursday, and a $79.38M wipeout on Friday, suggesting that the upside move gained sufficient momentum from short-sellers’ exit.
In a recent tweet, crypto analyst IT Tech highlighted visible differences between spot market flows and derivatives behaviour during this period.
Spot market participants remained limited, with the Coinbase Premium Index at -0.06% on Friday. Spot CVD stood at -$261.82 million, indicating moderate selling pressure outweighing buying pressure.
In contrast, CVD for perpetual futures shows a steady rise, and funding rates continued to be in positive territory, indicative of continued demand from long positions in leveraged instruments.
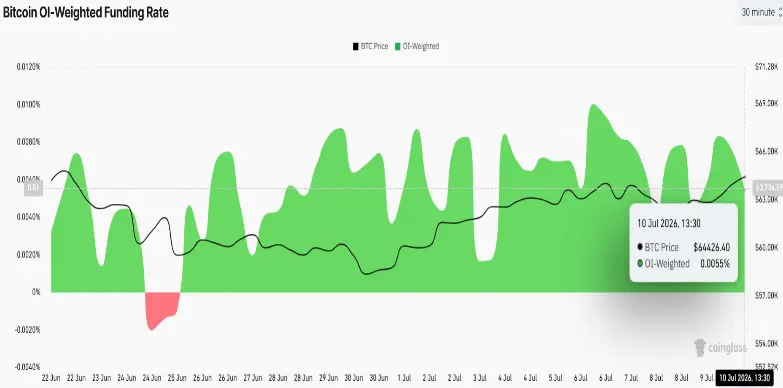
Coinglass data indicates that the OI-weighted funding rate is currently 0.0055%, indicating that long traders have a strong conviction to stay in their market position and pay a premium.
Spot Bitcoin ETFs in the U.S. have resumed their outflow trend after a relief earlier this week. On July 9, these funds reported $95.3 million in net outflows, according to Sosovalue data.
This shift suggests waning institutional demand for spot Bitcoin exposure, despite the rising prices on the futures market. This steady outflow can be attributed to renewed geopolitical uncertainty, macroeconomic challenges, and the risk-off trend in global markets.
This divergence between soft spot/ETF flows and high derivatives leverage points to the fragile nature of the current price recovery and increasing risk of market volatility.
Bitcoin Price May Retest $59k Amid Weak Bullish Momentum
The Bitcoin price showed a notable rebound from $58,527 to $64,400 within a fortnight, registering a gain of 10%. As a result, the asset’s market cap rebounded to $1.29 trillion.
The analysis of the technical chart reveals that the recovery coincided with a gradual decrease in trading volume, reflecting a lack of confidence among buyers. Moreover, the Bitcoin price remains below the previous swing high of $67,253 from mid-June, indicating that the price movement remains in a lower high, lower low pattern, which is visible on a clear downtrend.
If the bearish momentum persists, the BTC price could plunge 8.73% and retest a long-coming support trendline. Since November 2022, this ascending support has remained a key accumulation zone for buyers to recuperate the exhausted bullish momentum.
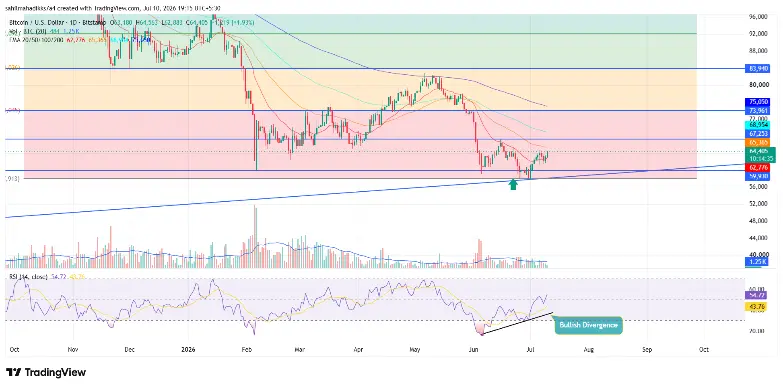
Interestingly, the Relative Strength Index (RSI) has started to form a higher low trend on the daily chart as price retests the $60,000 support. Such bullish divergence often appears at major support levels, signalling a higher potential for a rebound.
If the buyers continue to defend the $60,000 floor, the BTC price could chase overhead resistance of $67,250, followed by $74,000.