




Top Takeaways:
- XRP ETFs have diverged sharply from the broader market weakness by attracting nine consecutive weeks of net inflows.
- The spot Bitcoin ETF and spot Ethereum ETF recorded eight weeks of steady outflow, signalling a cautious pause from traditional Wall Street investors.
- XRP price broke out from a year-long resistance wedge pattern, indicating an initial sign of trend reversal.
XRP, the native cryptocurrency of the XRP ledger, is down 1.8% on Monday to currently exchange hands at $1.13. While this downtick follows the broader crypto market pullback today, the 24-hour trading volume associated with XRP records a 28.87% drop to $1.21 billion, signalling weak conviction from sellers. In addition, the U.S.-based spot XRP ETF recorded a 9-week streak of consecutive inflows, signalling steady institutional buying pressure.
XRP ETFs See 9-Week Inflow as BTC, ETH Bleed
The broader crypto market remains in a near-term consolidation trend as the top two digital assets, Bitcoin and Ethereum, witness active profit-booking and a prolonged streak of ETF outflows. The selling pressure can be associated with macroeconomic uncertainty and lack of clarity in the U.S.-Iran war.
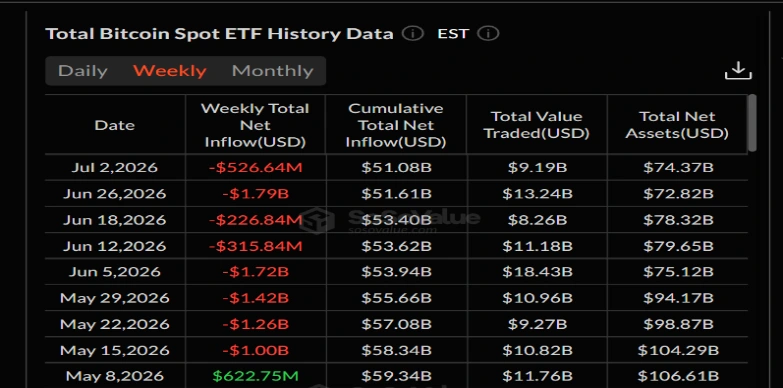
According to SoSoValue, the spot BTC ETFs have recorded eight consecutive weeks of net outflow, which logged ~$8.26 billion of net capital reduction. This marks the longest and most aggressive outflow streak for spot Bitcoin ETFs since their launch.
Similarly, the spot ETH ETFs have also recorded eight weeks of net outflow, with investors withdrawing approximately $1.20 billion during the period.
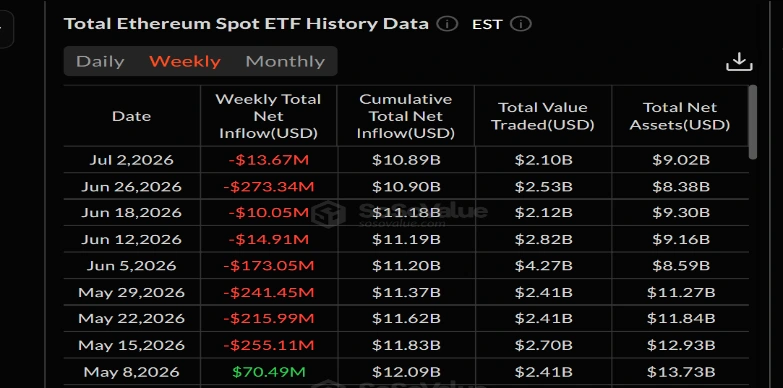
Such a prolonged outflow streak suggests that large investors remain cautious and institutional liquidity is drifting away from these volatile crypto assets.
Bucking the trend, the XRP ETF emerged as a favourable safe haven for institutional investors, logging nine consecutive weeks of net inflows. SoSoValue data shows this sustained buying streak injected a net total of roughly $200 million into the funds, calculated via the cumulative column difference.
The continued demand also marked the third positive month for the token’s underlying instruments. The total net inflows to all U.S. XRP funds since the historic product launches have officially surpassed $1.49 billion. These issuers have accumulated a notable share of the token’s liquid supply, with Bitwise holding $312.71 million and Canary (XRPC) holding $250.76 million in net assets.
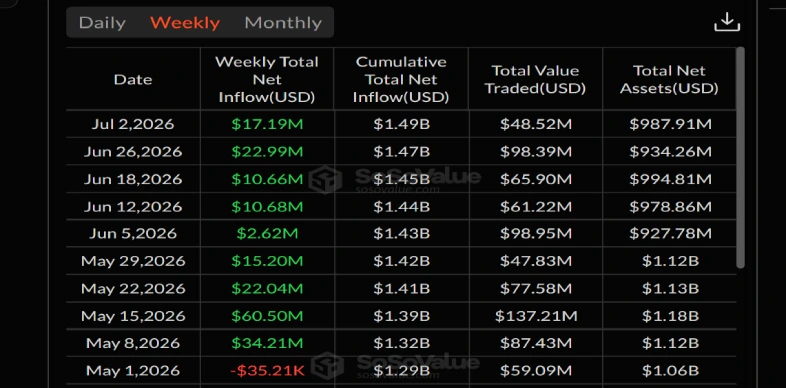
While the XRP price remains in a consolidation trend, similarly to other major cryptocurrencies in the short-term, this persistent removal of liquid supply from the open market cannot be ignored forever.
As hundreds of millions of tokens are absorbed into institutional ETF custody, available supply is gradually being pulled off centralized exchanges, progressively tightening order book liquidity.
XRP Price Breaks out of a Year-Long Reversal Pattern
Since last week, the XRP price witnessed a notable rebound from $1.03 to $1.15, registering a growth of 11.35%. Amid this upswing, the coin price flipped a year-long resistance trendline of a falling-wedge pattern into potential support.
This chart setup had carried a prolonged correction trend within two converging trendlines, suggesting that the recent breakout could have an impact of similar momentum. With today’s price drop, the XRP price reverts to $1.13 trading value, potentially retesting the breached trendline.
With an aggressive XRP ETF inflow, the XRP price prediction could likely hold the breakout level and drive a renewed recovery to $1.6, followed by a leap to $1.8 and $2.
The Relative Strength Index (RSI) bounced to 51, indicating a significant improvement in market sentiment for Ripple cryptocurrency. However, the indicator still wavers in the neutral region, suggesting that the coin price still lacks sufficient momentum for strong recovery.
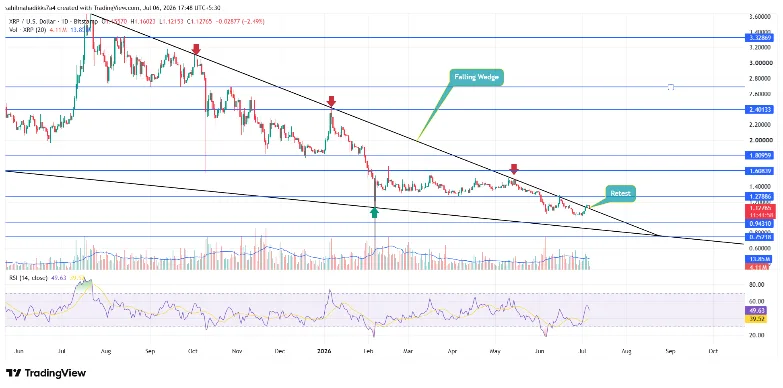
On the contrary, if the current retest re-enters the wedge structure, the bullish thesis would get invalidated, and sellers would attempt a $1 breakdown.