




Top Takeaways:
- BTC Net Unrealized Profit/Loss (NUPL) indicator currently reads 0.158, reflecting reduced unrealized profits.
- The 100-day NUPL EMA zero line is the key on-chain level to monitor for potential bottom confirmation.
- According to Fibonacci retracement level, the Bitcoin price could face overhead resistance at $73,910, $83,916 and $92,000.
BTC, the original cryptocurrency, is down 1.25% ahead of Tuesday’s U.S. market hours, trading at $63,229. However, this downtick is likely a short-term halt after the price witnessed a notable rebound from last week’s low of $57,735. In addition, the 100-day EMA of Bitcoin’s NUPL indicator is gradually heading to the zero line, a trigger that signalled market bottom during the previous four cycles.
Bitcoin Recovery Faces Doubts as Open Interest Flatlines
Over the past nine months, the Bitcoin price has plunged from $126,272 to $63,135, projecting a loss of roughly 50%. Subsequently, the asset’s market cap has also dropped down to $1.26 trillion. The BTC price is still wavering around the $60,000 level amid geopolitical uncertainty, macroeconomic jitters, and recent outflows from spot BTC ETFs.
Following the correction, Bitcoin’s NUPL indicator has dropped to 0.158, offering insight into the proportion of Bitcoin holdings in profit. To smooth out short-term volatility, the indicator’s 30-day exponential moving average (EMA) now stands at 0.155, while the 100-day EMA is 0.215. One of the major developments came on June 2, when the 30-day average curve fell below the 100-day average curve, both of which are now declining toward the zero level.
Reviewing historical data reveals similar patterns at previous cycle lows. The 100-day EMA of NUPL dropped to -0.58 near $2 in late 2011, reached -0.22 around $182 in 2015, settled near -0.15 at $3,206 in 2018, and $15,792 in late 2022. The severity of each successive low was less than the previous, thus showing a gradual change in market behaviour over time.
Unlike the past few cycles, the current cycle has not yet registered a negative 100-day EMA reading, with the lowest point still in positive territory. This divergence, and the recent moving average crossover, signals a waning period of positive momentum and transition in the cycle. The absence of a zero cross so far suggests the market may be testing new dynamics compared to earlier periods.
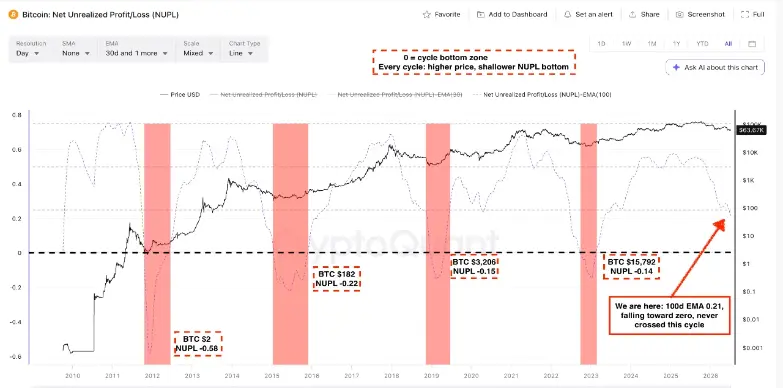
Thus, the NUPL trends suggest that Bitcoin is in a late-cycle position with profit realization cooling off and a potential bottoming process looming. The shallower historical pattern suggests higher resilience in the asset, which may translate to a higher support level this time.
Monitoring the 100-day EMA’s approach to zero will be essential, as crossing or holding above it could signal either a traditional capitulation phase or an evolution toward more stable cycle behavior in an increasingly mature Bitcoin market.
Bitcoin Price Returns to Multi-Year Support Trendline For Next Rebound
Over the past week, the BTC price showed a bullish bounce from $58,527 to the current trading value of $63,229, registering a gain of 8.03%. This rebound signals Bitcoin’s resilience above the $60,000 level and an ascending support trendline, drawn since November 2022.
The dynamic support has remained a major accumulation zone for buyers as the previous two reversals uplifted BTC with triple-digit gains.
However, BTC’s daily chart shows that price action still follows a lower high and lower low formation, indicating an established downtrend in the market. Therefore, a potential consolidation above the aforementioned trendline is more likely to occur before BTC price gives a clear reversal signal.
If the bullish momentum persists, the coin buyers could challenge the overhead resistance of the 23.6% Fibonacci retracement level at $73,910, followed by the 38.2% FIB level at $83,916, before the Bitcoin price could finally hit the pivot level of the 50% FIB at $92,000.
A breakout above the 50% could signal the end of the current correction trend.
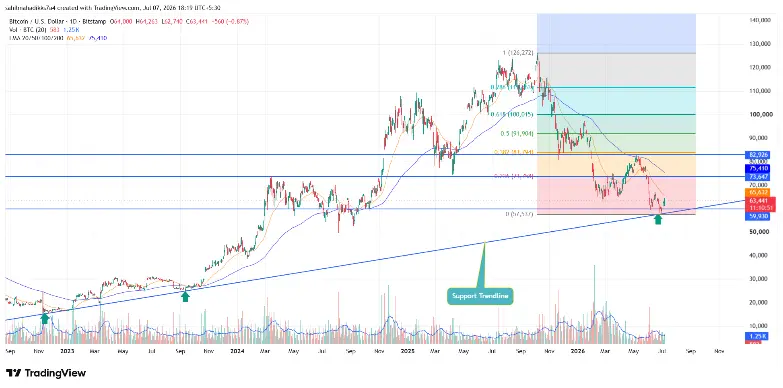
However, if the Bitcoin price gives a bearish breakdown below the aforementioned support trendline, the bullish thesis will get invalidated, and the sellers could drive an extended downtrend.