




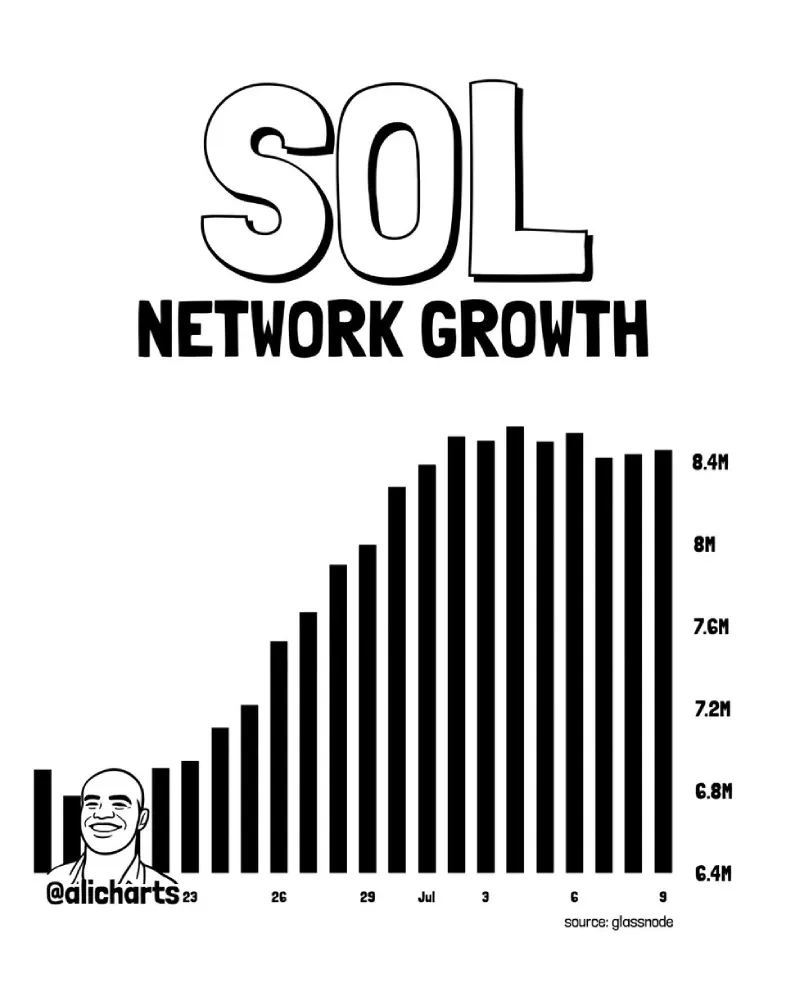
- Solana price holds $75 floor as the network adds an average of 8.4 million new wallet addresses per week.
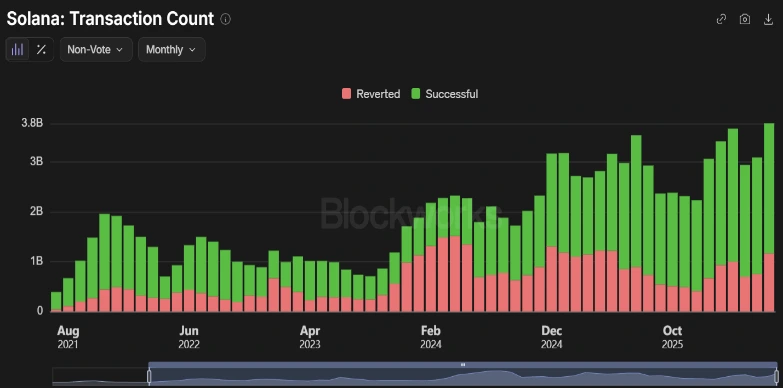
- Monthly non-vote transactions climbed to a record 3.77 billion, reflecting unprecedented on-chain activity across the ecosystem.
- There is a possibility that the $SOL price may plunge another 5.8% to retest a key support trendline near $72 before getting ready for the next leap.
Solana, the seventh-largest cryptocurrency by market capitalization, showed a slight downtick of 0.5% on Monday, currently trading at $76.3. While this drop followed Bitcoin’s pullback below $63,000, Solana’s price maintained strong resilience above the $75 floor, as evidenced by a long-tail rejection. The underlying buying pressure can be associated with recent on-chain growth, including non-vote transaction volume and new addresses joining the network.
SOL Price Backed by Record Adoption and Rising ETF Inflows
Since last week, Solana price has dropped from $81.94 to $76.31, registering a loss of 6.87%. This drop indicated SOL’s underperformance compared to broader market trends as Bitcoin held above $60,000 and the top altcoin, Ethereum, showed sustainability above $1,750.
Even though the price of the token was weak, Solana managed to record heightened network activity, which indicates a surge in underlying demand pressure.
Details shared by analyst Ali Martinez reveal that Solana’s blockchain has seen significant gains in its user base. In his update, he noted that the weekly number of new wallet addresses being added to the network averaged 8.4 million per week.
Glassnode data shows clear weekly gains in recent bar charts from the end of June to the early weeks of July. The development of this trend indicates a wider engagement and increased reach in the Solana ecosystem, with address creation continuing to rise.
Recent observations shared by Lark Davis confirm that Solana continues to demonstrate robust network growth. Key metrics include monthly non-vote transaction volume reaching a new high of 3.77 billion and the stablecoin supply reaching $16.6 billion in Q2 2026, its highest level on record.
A comprehensive view of Blockworks data since 2021 shows a steady increase in successful transaction counts. This progress indicates higher real-world adoption, a higher number of developers joining in, and greater capital deployment across the network.
All in all, these metrics suggest increasing adoption and infrastructure resilience across the entire ecosystem, which could benefit network utility and the long-term sustainability of decentralized finance and payments.
In addition, the U.S.-based spot SOL exchange-traded funds (ETFs) showed a fairly consistent growth in recent weeks. According to SoSoValue, the funds recorded roughly $930.43K in net inflow last week, which pushed their cumulative net inflow to $1.14 billion.
The continued capital inflows suggest institutional investors remain confident in Solana’s growth prospects despite the current short-term volatility.
Solana Price Must Hold this Support Before a Leap to $100
On July 2, the Solana price gave a bullish breakout from a downsloping resistance trendline, active since mid-January 2026. Following this breakout, the SOL coin witnessed profit booking from short-term traders, leading to the current pullback in price.
This downswing could drag the price another 5.8% lower and retest the breached trendline as potential support at $72. If buyers manage to hold this breakout, the Solana price may witness renewed bullish momentum and chase overhead resistance at $82.9, followed by $90.7 and $100.
A bearish crossover between the MACD (blue) and signal (orange) lines of the daily moving average convergence (MACD) indicator accentuates the short-term selling pressure.
In addition, the SOL price has again slipped below the 20-day and-50-day EMAs, adding an extra layer of resistance against market buyers.
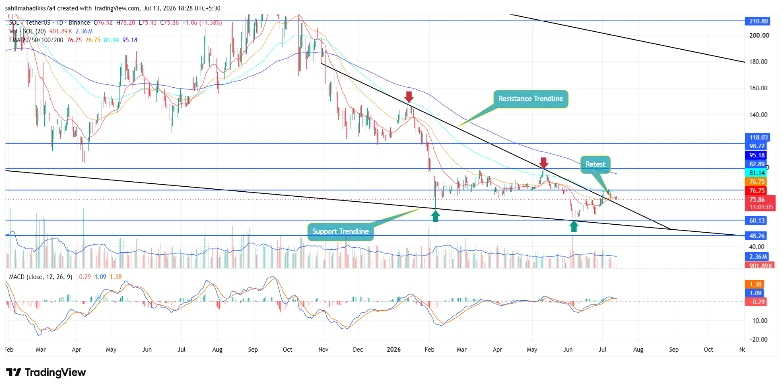
If the price of Solana breaks below the breached trendline during the current retest, the sellers could tighten their control over this asset and drive a continued downtrend to $60.