




- Bitcoin has crossed $80,000, but Fidelity’s stance is that it is too early to call the bear market over, suggesting November 2026 will be the next testing period for a structural cycle.
- The crypto market has shown growing immunity to negative news, such as a major hardware wallet security breach and the stalling of the U.S. CLARITY Act.
- The Bitcoin price holds a key support level above the 20-day exponential moving average and $82,300.
Fidelity Digital Assets has warned that Bitcoin’s recent bounce from $80,000 is still not a confirmed sign of the bear market’s end. In Fidelity’s Q4 Crypto Market Outlook report, Vice President of Research Chris Kuiper highlights a major structural shift approaching for the digital asset market in November 2026. While recent momentum has boosted optimism, Fidelity advises investors to focus on adoption indicators to gauge macroeconomic shifts rather than attempting to time the exact market bottom.
Fidelity Analysis Marks November for Potential BTC Bottom
Central to Kuiper’s analysis is the traditional four-year Bitcoin cycle. Bear market bottoms have historically occurred in approximately four-year time spans, and the previous cyclical bottom was in November 2022. If one followed this method, the next definitive cycle test window would be more or less around November 2026.
But it is important to note that historical cycles have never been repeated exactly, so short-term market timing is certainly not possible using these cycles alone.
Resilience to Negative News Highlights Seller Exhaustion
A major technical silver lining in the report is the market’s growing immunity to bad news. Past experience indicates that during a bear market, sharp sell-offs would follow regulatory roadblocks or security breaches. But recent bad news—including a major hardware wallet security incident and the structural stalling of the U.S. CLARITY Act—has failed to drive prices down.
This underlying resilience amid exhausted selling pressure suggests that the market is nearing a long-term cyclical low, and the broader crypto market is searching for the next major catalyst to spark a bullish reversal.
Crypto Adoption Recouples with Asset Fundamentals
Despite the negative sentiment hanging over the broader market, network adoption has quietly experienced explosive growth in 2026. Crypto asset manager Bitwise Investments stated in early July that the volume of stablecoin transactions has risen by 2.3 times compared to Visa transactions. At the same time, Web3 provider MetaMask shared data indicating that the Real-World Asset (RWA) tokenization market, which brings traditional assets such as real estate and government bonds to blockchains, has expanded rapidly in 2026 compared to any previous year.
The late-August price change is a sign that adoption metrics and token prices are now getting in sync again – a trend previously observed during the structural shift of the 2021–2022 market cycle.
A Shifting Digital Asset Policy Landscape
Following its passage in the House, the CLARITY Act is still stalled in the Senate, which aims to establish a wide-ranging regulatory framework by clarifying which federal agencies oversee which digital asset classes.
In the meantime, the SEC has unveiled a new regulatory proposal called Regulation Crypto Assets, which seeks to adapt certain registration exemptions for early-stage crypto asset issuances. While these policies do have some uncertainty around their timelines in the near term, Fidelity is emphasizing that the underlying network infrastructure continues to grow, and the basic value proposition of these networks is unchanged.
Bitcoin Price Holds Bullish Pattern Despite Recent Sell-off
On Tuesday, October 9th, the Bitcoin price bounced roughly 1.72% to trade at $83,123. This uptick bolstered buyers to hold their position above the 20-day EMA and its recent breakout from a double-bottom pattern that NameCoinNews highlighted in previous analysis.
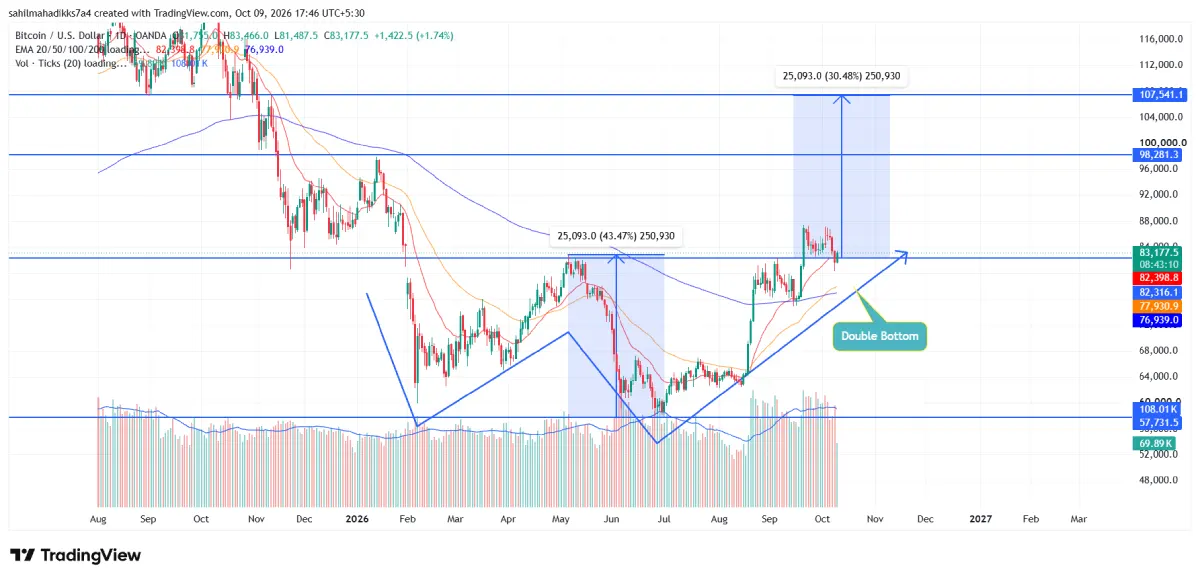
Over the last several months of consolidation, the Bitcoin price formed a classic reversal pattern called a double bottom above a $60,000 floor. Later, the coin price gave a decisive breakout from the pattern neckline resistance at $82,316 during the late September rally.
The recent pullback in Bitcoin price has temporarily weakened the bullish thesis of this pattern; buyers still hold key technical levels as mentioned above. If BTC price continues to maintain its hold above the $82,300 floor, the buyers could drive a higher rally towards $98,231 resistance, followed by $107,540.