




- The IOTA price breakdown from a triangle pattern signals a risk of a prolonged correction below the current low of $0.052.
- The latest U.S. military action against Iranian drone operations disrupted fragile diplomatic negotiations and intensified geopolitical uncertainty.
- According to the traditional pivot level, the IOTA price could seek potential support levels at $0.05 and $0.045, while the overhead resistance level lies at $0.057 and $0.062
On Thursday, the IOTA price slipped roughly 3% ahead of U.S. market hours to trade at $0.053. This drop aligns with the broader market pullback as renewed geopolitical tension and macroeconomic updates pulled capital away from risky assets. In addition, the IOTA price triggered a major breakdown from a key support zone, signalling a risk of prolonged correction in the near future.
IOTA Price Drops 3% as Middle East Tensions Shake Crypto Market
On May 28th, the global crypto market witnessed a 3.35% drop in its market capitalization, currently wavering at 2.45% according to CoinMarketCap data. This downtick followed Bitcoin’s continued correction and a drop below $75,000 as the conflict at the Strait of Hormuz surfaced again.
Fresh U.S. airstrikes targeting Iranian drones near the vital waterway derailed fragile ceasefire and trade negotiations. Iran reacted quickly with a retaliatory attack at a U.S. base in Kuwait, causing a jolt in global markets and a spike in energy costs.
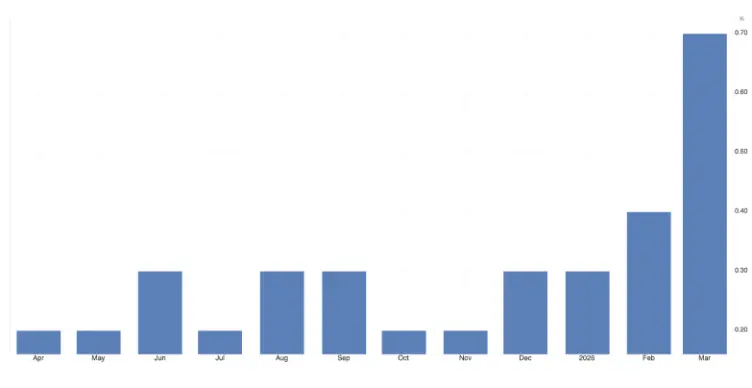
The renewed war jitters have reignited inflation concerns worldwide. Brent crude futures jumped more than 2.5% amid the turmoil. Markets are now closely watching the upcoming U.S. PCE inflation data, which is expected to show a 0.5% month-over-month increase for April 2026 — following a 0.7% rise in March, the highest reading since June 2022.
If the data meet expectations, it would underscore persistent inflationary pressures. Stronger-than-anticipated figures would raise the odds of a Federal Reserve rate hike later in 2026, further weighing on risk assets such as cryptocurrencies.
In line with the broader market pullback, the IOTA price dropped around 3%, which triggered $43.26k in long liquidation.
Interestingly, the total value of outstanding futures and options contracts tied to IOTA has witnessed steady growth over the past two and a half months. According to Coinglass data, IOTA’s Open interest showed a gradual recovery from $10.56 million on February 9th to $16.61 million at press time.
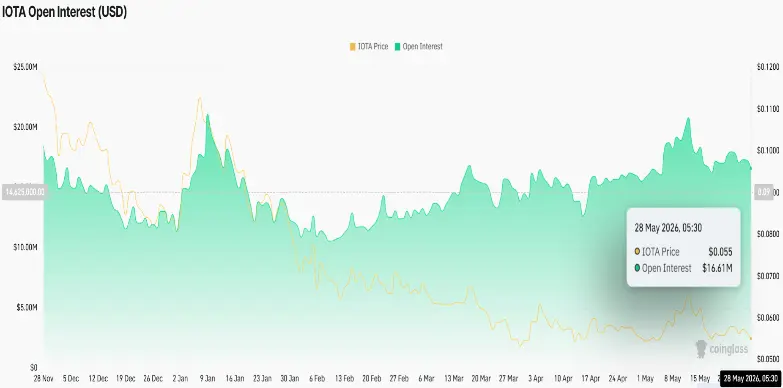
While the price remained in a sideways trend, the rising open interest indicates rising conviction among traders (short and long positioned) for a potential move in the IOTA price.
IOTA Price Breaks Below Multi-Month Consolidation
Following a steady correction in January 2026, the IOTA price shifted its trajectory sideways around the $0.06 level. An analysis of daily technical charts shows this consolidation resonating within two converging trendlines, indicating the formation of a symmetrical triangle pattern.
Historically, this continuation pattern has been spotted within an established trend, where it allows trading to recoup the prevailing market momentum. The price drop today gives a fresh breakdown below the pattern’s support at $0.055, signalling the risk of continued correction ahead.
Based on our short-term IOTA price prediction, if the daily candle closes below the breakdown support, the IOTA price could witness intense selling pressure and drop to a new all-time low.
As the IOTA coin has never tested this price range, the traditional pivot signals potential support levels at $0.05 and $0.045.
The momentum indicator, the Relative Strength Index at 39 accents the broader bearish sentiment tied to IOTA.
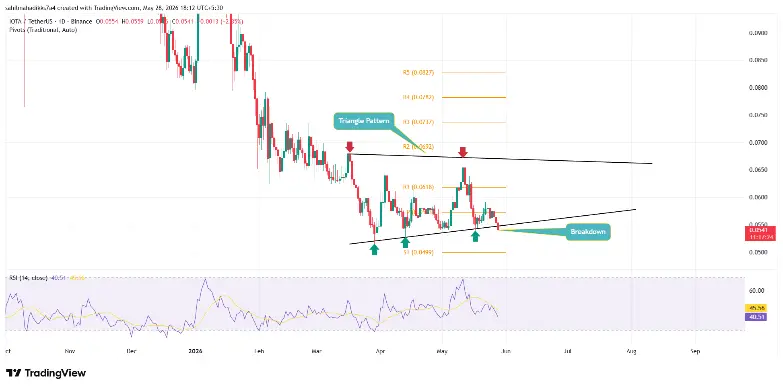
On the contrary, if the coin price manages to defend its current low of $0.052, the buyers could attempt to reclaim $0.06. Doing so would allow it to continue its ongoing consolidation while rebuilding bullish momentum for the next breakout.