


Key Highlights:
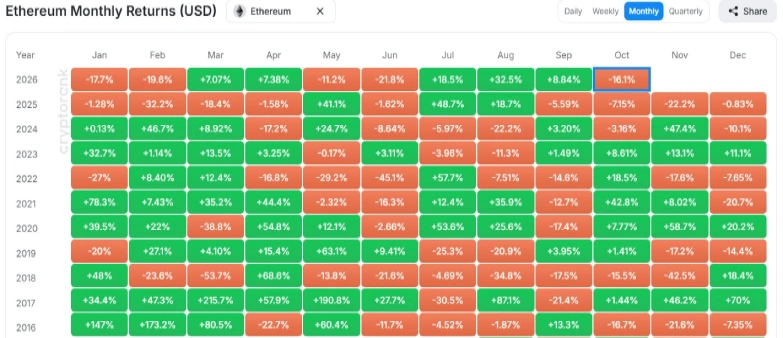
- Ethereum fell 16.1% to $2,510 in October 2026, ending a three-month rally with its second-worst October performance since 2016.
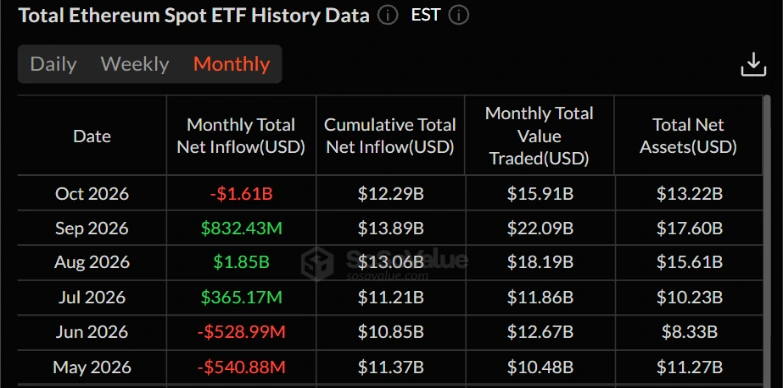
- U.S. spot ETH ETFs saw a record $1.61 billion monthly outflow, indicating a strong institutional capital flight and a significant drop in market liquidity.
- ETH price extends its prevailing correction trend, resonating within the two downsloping trendlines of a wedge pattern.
ETH, the second-largest cryptocurrency by market capitalization, recorded a 16.1% drop in October 2026. Along with a broader market pullback, Ethereum’s price faced intense selling pressure due to record institutional capital flight, macroeconomic pressure, and weak market sentiment due to a recent security breach at Binance.
Ethereum Price Records its Worst Second October Since 2016
The crypto community often refers to October as “Uptober” because of the historical tendency of Bitcoin and the broader crypto market to experience major price rallies and strong positive returns during the month.
However, in 2026, the market’s expectations were broken as the pioneer cryptocurrency, Bitcoin, recorded a 7.31% fall, and Ethereum’s price fell 16.1%, according to CryptoRank data. For Ethereum, this price performance marked its second-worst October performance since 2016 and snapped a three-month winning streak.
One of the key reasons that contributed to this selling pressure was recorded in the institutional capital outlook from the spot Ethereum ETFs. In October, U.S-based spot ETH ETFs recorded a massive $1.61 billion net outflow, according to Soso value data.
The single-month redemption was the largest ever recorded for the funds to date. This aggressive liquidation ran over five consecutive weeks, with $431 million of net inflows in the final week of October alone, sharply diminishing buy-side liquidity and cumulative net inflows.
Market uncertainty continued to rise in October as macroeconomic jitters increased. After the U.S. Federal Reserve expressed continued uncertainty about persistent inflation at a meeting on October 28, a decision to keep the benchmark rate steady in the 3.75% – 4.00% range put a dampener on broader financial markets.
However, a higher-for-longer outlook or potential interest rate hikes often push bond yields higher and dampen investor appetite for risk assets like cryptocurrencies.
In addition, a massive hack involving $6.3 billion on Binance exchange saw markets take a massive plunge into systemic panic late in October. A portion of the stolen funds was quickly frozen by stablecoin issuers, but the attackers were able to cash out with ETH- and BTC-concentrated assets worth billions of dollars.
The unprecedented multi-billion-dollar supply dump caused a lot of fear among spot traders and created immediate selling pressure. This panic quickly spread to the derivatives market, causing huge sell-offs of leveraged long positions.
Ethereum Price Extends Correction Within Falling Wedge Pattern
During the October correction, the Ethereum coin showcased a price decline from $2,705 to $2,510. Simultaneously, the asset’s market cap has dropped to $279.15 billion.
Interestingly, the price pullback remained within two downsloping trendlines, indicating the formation of a falling wedge pattern. As shown in the chart below, the two slopes act as dynamic resistance and support for traders, and continue to extend a downward trend until the trendlines are broken.
Earlier today, the Ethereum price marked an intraday high of $2,317 to hit the 200-day exponential moving average, before reverting to $2,284. If the bearish momentum persists, the coin price could briefly retest the overhead trendline and resume its prevailing correction.
The post-reversal drop could drag the ETH price back to $2,000. The relative strength index (RSI) indicator at 36 highlights the intact bearish sentiment in the market.
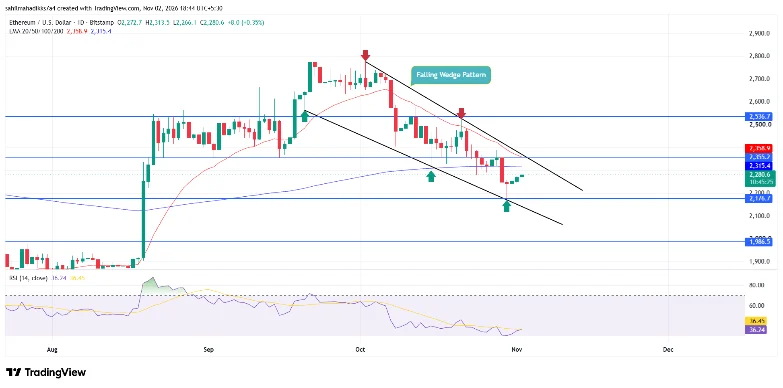
On the contrary note, the falling wedge has often provided a counter-trend move if buyers breach the overhead trendline of the pattern. The possible breakout could renew the exhausted bullish momentum in price for a renewed recovery trend.