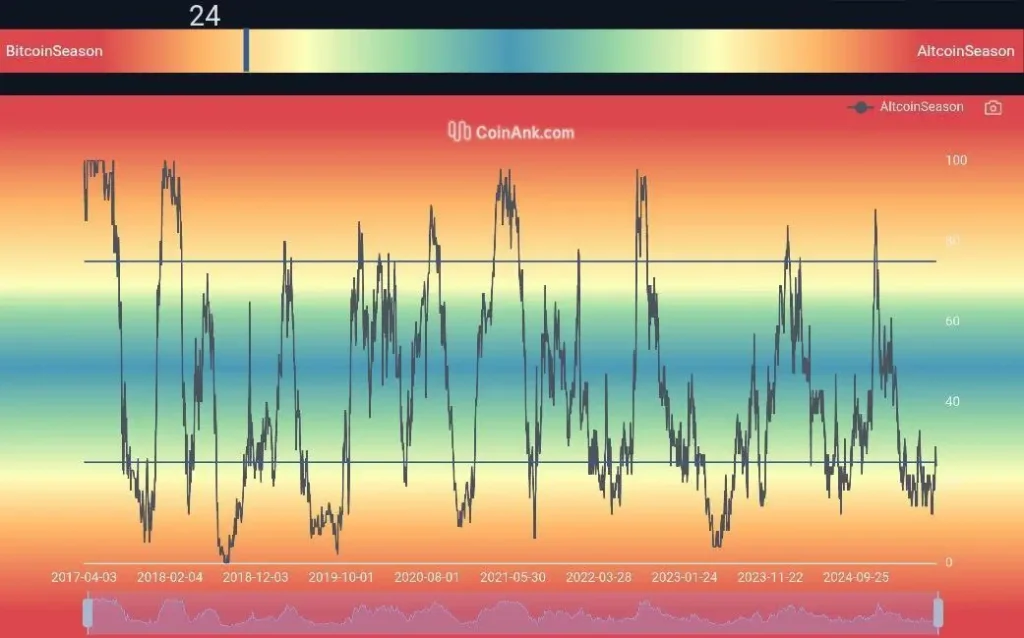
Crypto analyst Ted has spotted a familiar signal—and it’s catching traders’ attention. The Altseason Index plunged to 25, brushing one of its lowest marks in recent memory. That might sound bearish, but for seasoned market watchers, it’s often the calm before an altcoin storm.
The Altseason Index, tracked by CoinAnk.com, gauges whether altcoins are outperforming Bitcoin. Below 25? It’s officially “Bitcoin Season.” But here’s the twist—this level has historically marked the start of major altcoin rallies. It’s the point where the tide often turns and altcoins begin to steal the spotlight.
Ted highlights this exact setup: “Whenever the Altseason Index has reached this low, alts have outperformed.” And history proves him right. At the end of 2019, during mid-2020, and at the beginning of 2023, the index dropped to these approximate values, right before altcoins, including Ethereum and Cardano, entered the triple-digit profit range.
Curious where they might go next? Dive deeper into our Ethereum price prediction and Cardano prediction for expert forecasts and breakout scenarios.

Altseason Gauge (Source: X Post)
The chart paints a coherent narrative: Bitcoin’s dominance reaches its peak, the mood in the market calms down, and then the altcoins come in. A similar arrangement is happening today. Bitcoin’s rally has lost steam, and the Altseason Index is starting to repeat a pattern of consolidation prior to a breakout.
Could Q3 2025 be the start of another altcoin cycle? The ingredients are lining up: low index levels, a quiet Bitcoin market, and a familiar technical pattern. If history repeats, altcoins could be gearing up for a strong comeback.
Altcoin Pump Cycle (Altseason) May Begin Next Week
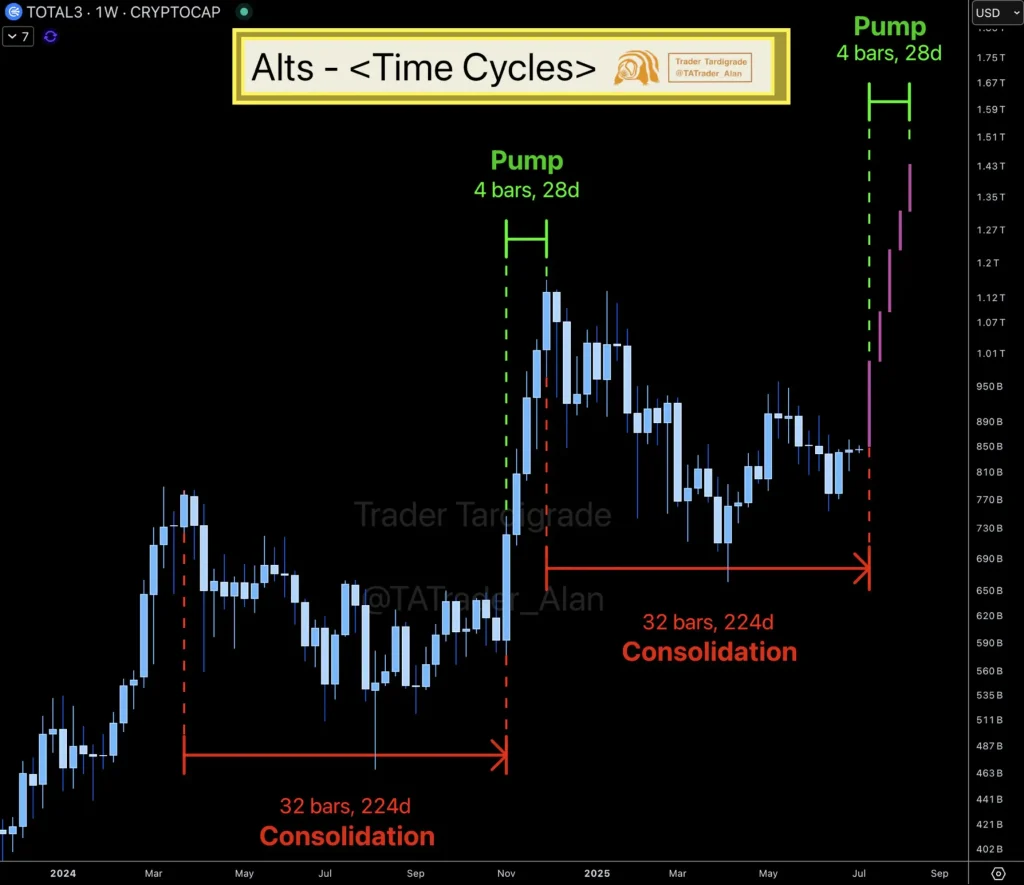
Adding further fuel to the altseason outlook, Trader Tardigrade highlights a recurring time cycle on the $TOTAL3 weekly chart. According to this trend, the altcoin market is ripe to go on a roar as soon as next week, following historical precedents of related breakouts shortly after comparable consolidation periods.
As shown in the tardigrade chart, there have been two previous 224 days (32 weeks) of consolidations, each preceded by a violent altcoin rally that lasted exactly 28 days (4 weeks of price action). The most recent cycle, now completed, mirrors the previous one almost identically, setting up what could be the third wave in a recurring pattern.
Altseason Chart (Source: X Post)
The chart’s symmetry is striking. After 32 bars of market sideways movement—marked by tight ranges and low volatility—altcoins experienced rapid price expansions during a brief 4-week window. These “pump” phases represent sudden capital inflows and broad altcoin outperformance. The pattern’s precision has given the community a new reason to watch the calendar closely.
If this structure repeats, the current setup—now sitting at the end of the second 224-day consolidation zone—could lead to another high-momentum move in altcoins, possibly pushing the total alt market cap above the $1.5 trillion mark and beyond.


