

- The formation of an inverted head and shoulders pattern drives short-term consolidation in Bitcoin price.
- BTC’s Market Capitulation Index shows no evidence of widespread market distress.
- BTC’s fear and greed index dropped to 48%, indicating a neutral sentiment among market participants.
On Friday, September 19, Bitcoin dropped over 1.3% and retracted to $115,597. The fall discouraged the mood of the traders who had thought of a more pronounced recovery after the Federal Reserve cut the rate by 0.25%. The on-chain indicators do not show any sign of capitulation despite the brevity of the weakness and the continuing risk of additional retracement. Meanwhile, technical charts indicate the possibility of a bullish reversal process, indicating that buyers may make a counterattack.
BTC’s Capitulation Index Signals Stability Despite Pullback
Over the last two weeks, Bitcoin price has staged a steady rebound, climbing from $107,272 to $117,968 — a near 10% advance. The upswing appears driven by investor positioning ahead of the U.S. Federal Reserve’s anticipated policy move. With rate cuts aligning to expectations, many market watchers looked for Bitcoin to extend its rally toward the $125,000 mark.
Instead, the asset has stalled below a key resistance level at $117,381, which has capped upside momentum for more than a week. Today’s intraday pullback underscores the risk of a renewed corrective phase, though recent on-chain metrics continue to show no evidence of capitulation.
Since July 2024, Bitcoin has continued to show resilience, with no indicators pointing toward widespread market capitulation. Alphractal analytics tracks potential capitulation events through its Market Capitulation Index, a composite metric that assigns points based on three distinct stress signals.
The first signal, hash capitulation, measures declines in the network’s hash rate. A drop of more than 30% over a 30-day period contributes a point to the index. The second, price capitulation, considers sharp losses in market value, adding a point if the asset experiences a drawdown exceeding 50%. The third, supply capitulation, tracks short-term selling activity, flagging instances where the seven-day active supply surpasses 15% of circulating tokens.
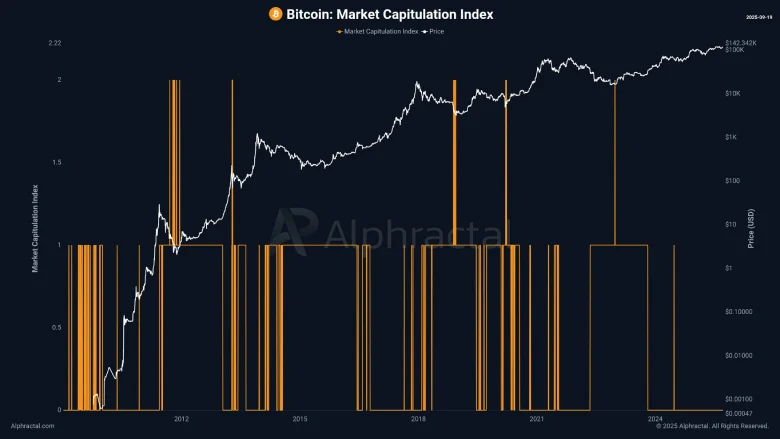
Each of these criteria is weighted equally, with the index producing scores from 0 to 3. Readings of 2 or 3 indicate heightened market stress and a higher probability of capitulation events, while scores of 0 or 1 reflect stable conditions.
Since mid-2024, Bitcoin has maintained low readings on the index, demonstrating stability across network activity, price trends, and token circulation despite volatility in the broader cryptocurrency market.
Bitcoin Price Delays Bullish Breakout Amid Reversal Pattern Formation
Since last week, the Bitcoin price has been wavering below the $117,381 resistance, as buyers lack sufficient momentum to drive a bullish breakout. An analysis of the daily chart shows this consolidation as the potential formation of an inverted head and shoulders pattern.
Three troughs characterize the chart setup: the middle head that drives a sharp correction and two shallow shoulders on either side. If the pattern holds true, the coin is likely to witness the formation of a right shoulder, which could seek support at $113,300.
An upward incline in daily exponential moving averages (20, 50, 100, and 200) accentuates the broader bullish sentiment in price.
A potential rebound from the $113,300 floor would push the price against the $117,381 resistance. An upside breakout will accelerate the bullish momentum in BTC price to drive a 6% surge and hit a new high near $125,000.

On the contrary, if sellers continue to defend the $117,381 resistance, the Bitcoin price will prolong the current consolidation.
Also Read: USDT Dominates Stablecoins with Massive New Holder Growth