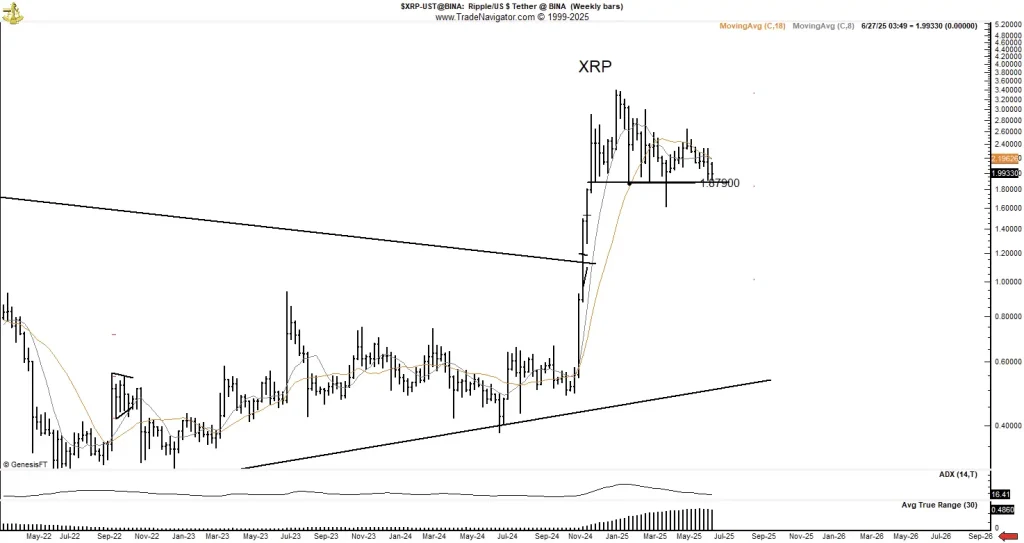
Legendary chartist Peter Brandt has put XRP back in the spotlight, hinting at a possible Head & Shoulders top forming on its weekly chart—a pattern often linked to trend reversals. But before panic sets in, Brandt adds a vital twist: “For the sake of the uneducated trolls among you, this chart need NOT be interpreted as bearish.”
In his recent analysis, Brandt points to an April 7 price spike as an “out-of-line movement”—a market quirk rather than a meaningful break in the chart’s structure. The real action, he says, is happening now. XRP is hovering right at a critical support level near $1.879, and what it does next could shape its near-term future.

XRP Price Chart (Source: X Post)
He makes it clear: if the XRP token holds this level, the pattern may lose its grip. But a close below the $1.80s? That’s when he’ll revisit the outlook. With the chart poised at a technical pivot, Brandt’s message to traders is simple—watch the level, not the noise.
XRP Price at Crossroads: Breakout or Breakdown?
The chart shows that the cryptocurrency has recently surged above a long-term resistance line but has since entered a consolidation range. Price action has been confined between $2.40 and the support level near $1.879, where the neckline of the possible H&S formation lies.
The 18-period and 8-period moving averages currently converge near $1.99, further supporting the significance of this level. A decisive close below support could suggest a breakdown, whereas holding this level might keep the bullish bias intact.
In the meantime, the Average Directional Index (ADX) value at 16.41 suggests a declining trend, and the Average True Range (ATR) at 0.4860 demonstrates average volatility over the past few weeks. The configuration is inconclusive and heavily dependent on whether the cryptocurrency can hold its positions above the neckline.
XRP Liquidation Zones Show Tension Building
The XRP liquidation map presents a high-stakes setup that is brewing right under the surface. The tightest accumulation of long liquidation pressure lies at 1.759, with almost $81.75 million in netted positions at risk. Should the token drop to such a zone, it will likely allow a flurry of liquidations, which would speed up the downturn in a domino effect.
XRP Liquidation Map (Source: CoinGlass)
On the other hand, there is a significant stress point to the short liquidations that is hanging in the air. In case XRP overcomes the nays of major obstacles around $2.26, it can short-squeeze a value of around $65.91 million. This would probably propel prices sky high as traders scramble to hedge positions, fueling a bullish trend.


