- SEI price eyes a multi-year breakout with a possible 160% rally toward the $0.90 target zone.
- Ali’s roadmap shows interim resistance areas at $0.51, $0.63, and $0.75 price thresholds.
- On-chain readings highlight an active tug-of-war between bullish forces and bearish resistance.
SEI price has been navigating heightened volatility, consolidating within a falling wedge pattern since mid-2024. At this point, the token stands at a crucial position, and market analysts are eyeing a probable 160% gain in order to scale a high of $0.90. Under extreme bullish circumstances, the forecasts can even surpass this level, which hints at a possible turning point for the cryptocurrency.
SEI Price Target: Is a Breakout Toward $0.90 Imminent?
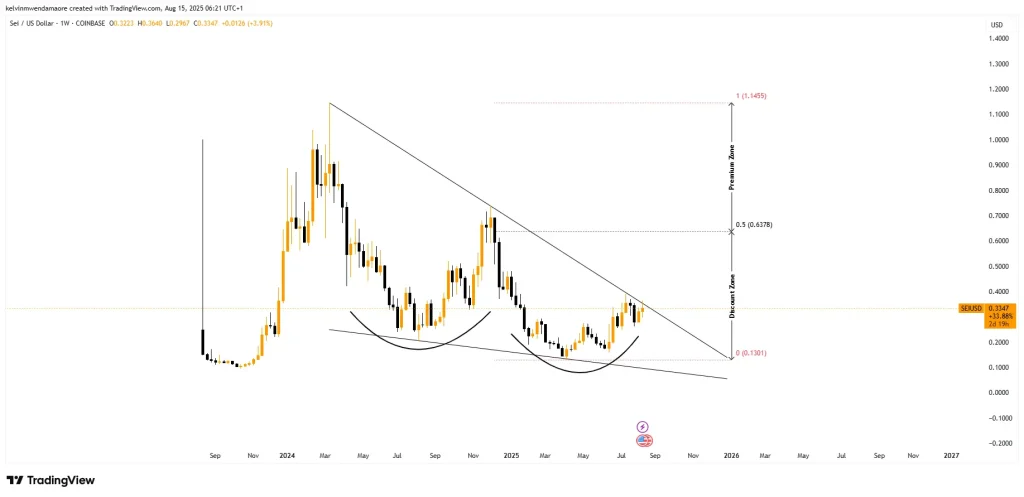
The falling wedge formation, referred to as the bullish reversal pattern, was first initiated in March 2024 when SEI was at the price of $1.14. The same trend has since helped establish the token’s ever-narrowing ranges, which are now testing the upper resistance band of the wedge again.
This breakout would be confirmed by a conclusive weekly candlestick close above this capping trendline, which could lead to an explosive upward surge. Further support of this arrangement is that SEI is situated in the discount zone, a price segment where value-seeking consumers often intervene.

SEI Price Chart (Source: TradingView)
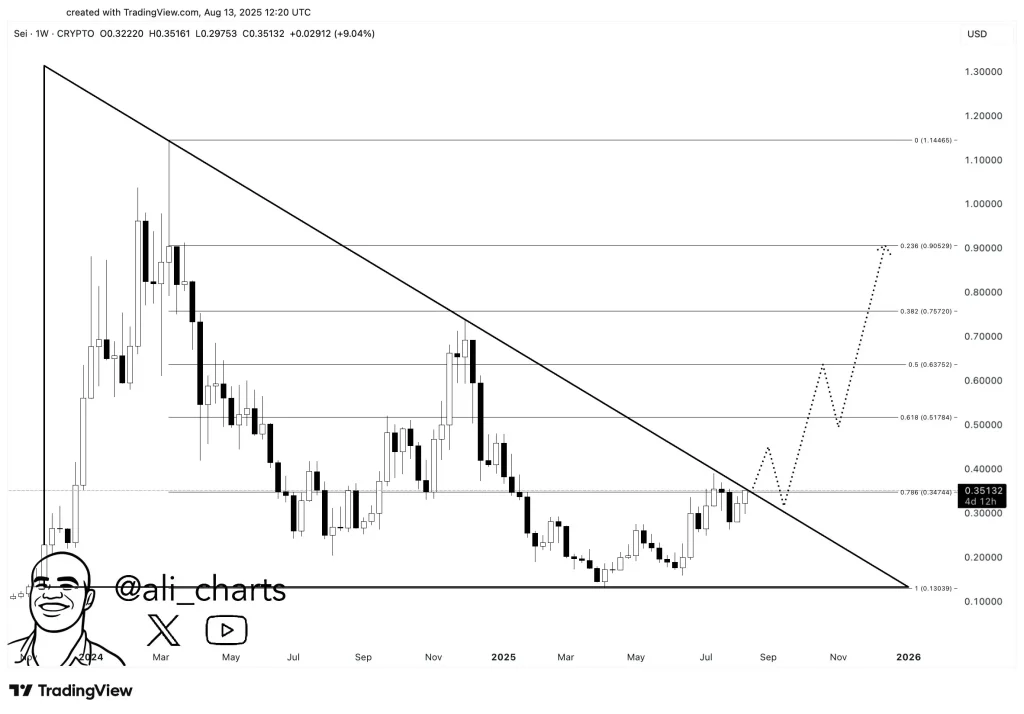
Such conditions increase the likelihood of renewed accumulation, which could fuel a sustained push higher. Market analyst Ali_charts breaks down the setup, mapping a precise roadmap that could lead SEI toward its projected rally.
His chart reflects a possible sequence of breakout, retracement, and continuation phases—a structure that aligns with traditional technical playbooks for wedge reversals. The overview places the primary upside target at $0.90, corresponding with the 0.236 Fibonacci retracement level.
SEI Price Chart (Source: X)
In his analysis, the route to this milestone is set to incorporate intermediate resistance checks at $0.51, $0.63, and $0.75. As long as the momentum is maintained, the bullish structure has the potential to extend above the price of $0.90. Coupled with the round bottom base that SEI has been building over the past year, the environment appears to be conducive to turning the mood to active accumulation.
On-Chain Indicators Highlight Key Pressure Zones
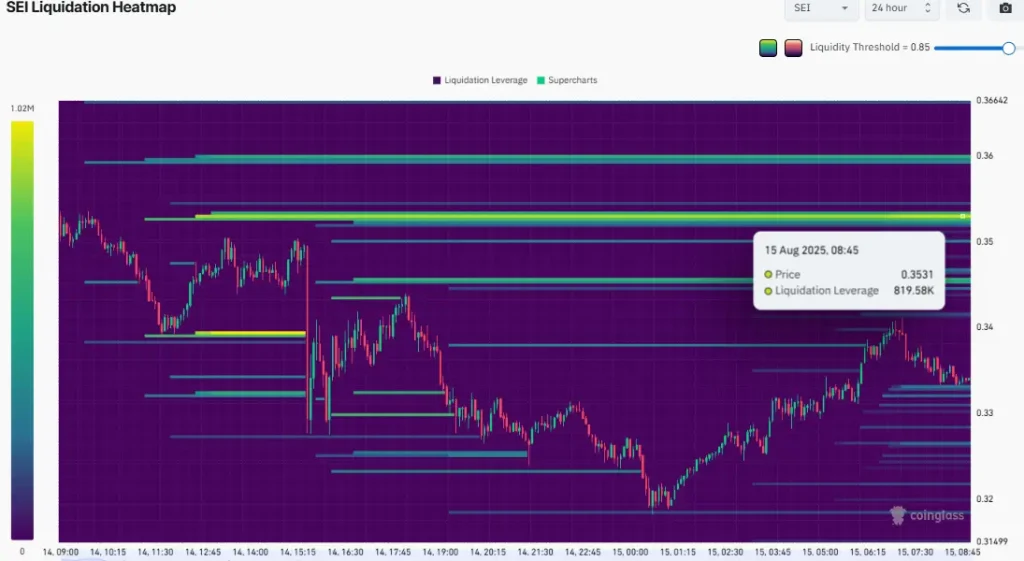
To supplement the SEI price outlook, the on-chain data show that a battle between bulls and bears is now occurring. According to the liquidation heatmap on CoinGlass, there is a congested pack of short positions in and around the $0.35 mark, amounting to almost $820,000.
SEI Liquidation HeatMap (Source: CoinGlass)
This concentration can serve as a short-term resistance level to the token. In case SEI manages to breach above this region, a short squeeze may be initiated, which may force the cryptocurrency to move higher at a relatively faster pace.
Meanwhile, the cryptocurrency’s open interest (OI) has fallen by 18% within the last 24 hours to $291.34 million, which is below yesterday’s record of $358.71 million. Although this is an indication of some unwinding of leveraged positions, OI is still high, indicating continued trader interest.
SEI Open Interest (Source: CoinGlass)
During the same 24-hour period, SEI experienced long liquidations of $1.76 million as opposed to short liquidations of $91,170. This imbalance was preceded by a minor price retracement following the token hitting the upper limit of its falling wedge pattern. The sell-offs reinforce that the markets are sensitive at these technical levels.
SEI Liquidation Map (Source: CoinGlass)
Not to be left out, the OI-weighted funding rate is also lingering at the negative limit of -0.0015%, about to take a turn and enter the bearish zone. The shift may be an indication of a slight trader bias shift, with short positions to the fore in the event of downside pressure.


