Recent Bitcoin price volatility shows hopeful trends that contradict the market crash predictions for 2025. According to CoinMarketCap weekly reports, the BTC token received a significant price boost, bringing it from the previous $79k point to its current value at $92k.
Bitcoin passed a period of consolidation and range-bound movement before a breakout. This bullish momentum likely stemmed from renewed investor confidence, market accumulation, and possible macroeconomic factors.

BTC/USD Monthly Price Chart (Source: CoinMarketCap)
After testing support multiple times, Bitcoin broke through resistance and rallied sharply. The 5.90% monthly gain reflects strong demand and buying pressure. As a result, market experts are anticipating a bullish trendline from a low level to a high price performance nearing an all-time high level.
BTC Breakout Signals Bullish Path Toward $120K Targets
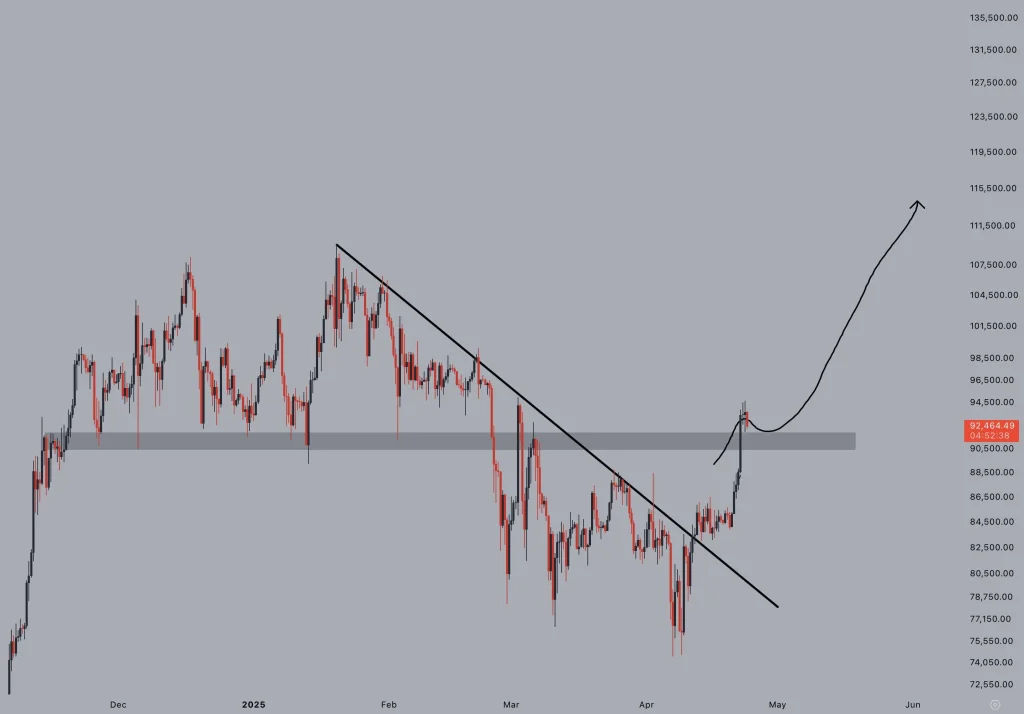
The chart from analyst CryptoJelleNL shows a breakout above a key descending trendline that has held since February. This breakout, confirmed by a successful retest of the broken trendline and reclaimed range lows around $92,000, indicates strong buyer interest. The shallow pullback following the breakout is a classic bullish continuation signal, often seen before new highs.
Now that it has turned from resistance to support, the gray area between $91,000 and $93,000 is serving as a springboard for additional gains. According to the curved trajectory, the projected move exceeds $115,000.
Bitcoin Price Chart (Source: X Post)
Continued momentum throughout this rally could lead to a price challenge at previous highs of approximately $120k. The technical system in this structure invalidates any prediction of a 2025 crash scenario. Instead, it aligns with a bullish Bitcoin forecast, suggesting Bitcoin may reach new all-time highs sooner than expected.
Bitcoin Jumps as ETF Net Flows Explode
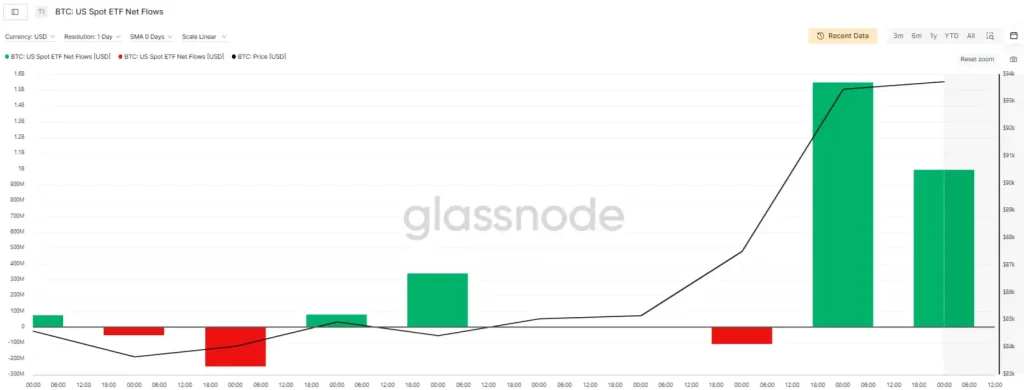
Bitcoin ETF net flows recorded a substantial surge, climbing from under $500 million to over $1.6 billion in less than 24 hours, according to Glassnode data. The sudden surge in trading volume matched an intense market price change where Bitcoin value soared from less than $85,000 to above $93,000.
The upward trajectory is evident in the black price line, which mirrors the volume increase in the green bars representing positive ETF net flows. Earlier intervals showed a mixed trend, with moderate inflows followed by outflows peaking near -$270 million.
Bitcoin US ETF Net Flows (Source: Glassnode)
However, the sentiment displayed in the final quarter of the left section underwent a significant transformation. A substantial financial movement worth more than $1.5 billion emerged in the right-end section, signaling a fresh bullish trend. The aggressive upward direction of the price line reflects how powerful long positions propelled the rally during this period.
Also Read: Bitcoin Price Eyes $100K Amid ETF Inflows and Exchange Supply Drop


