


ETH, the native cryptocurrency of the smart contract giant Ethereum, plunged over 1.5% during Friday’s U.S. market session. The selling pressure came as a post-rally correction as buyers are still recuperating from the exhausted bullish momentum. However, the latest on-chain data shows the recent rally did not receive whale support, and thus, the regulatory demand and corporate and fundamental growth likely boosted Ethereum’s value. Will the correction fade sooner than we think?
Ethereum Whale Supply Divergence Sparks Bullish Momentum
Over the past three weeks, the Ethereum price showcased a parabolic rally from $2,374 to a recent high of $3,850, projecting a 62% gain. A primary characteristic behind this surge was the regulatory development in the US as the House of Representatives passed three crypto bills: the Clarity Act, the Genius Act, and the Anti-CBDC Surveillance Act.
However, the recent data from Sentiment Analytics shows the supply of Ethereum held by whale wallets, excluding exchanges, has been steadily declining during the price rally. This inverse trend indicates a healthy structure.
Analysts hint that the momentum is not primarily driven by a few dominant holders but rather by the broader market signal, increasing corporate adoption, ETF inflow, and sustained investor participation.
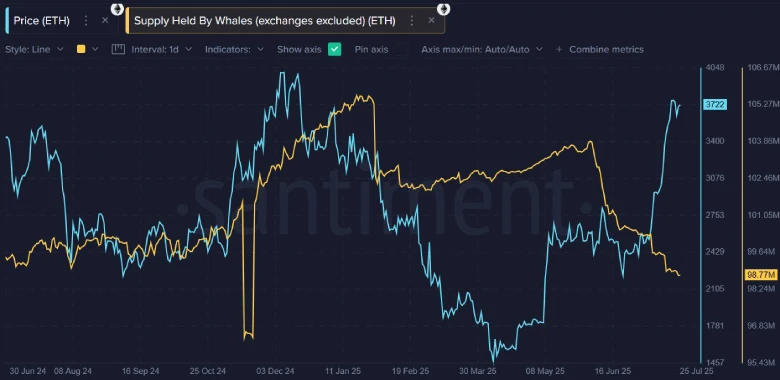
This also suggests that Ethereum’s price is becoming less influenced by the actions of major market players and is instead being driven by broader, more sustainable market forces.
Head And Shoulders Pattern Hints Prolonged Correction Ahead
In the last four days, the Ethereum price took a sharp pullback from a $3,816 high to the current trading price of $3,656, registering a 5.3% drop. The daily chart shows multiple candles with long rejections and short bodies, indicating a lack of initiation from buyers and sellers.
However, a closer look at the lower chart shows this pullback developed into an inverted head-and-shoulder pattern. This pattern is commonly spotted at major market tops and is characterized by three peaks, i.e., the middle head and short upswings indicating shoulders.
If the pattern holds true, the ETH price could plunge over 3% to challenge the neckline resistance at $3,500. A bearish breakdown below this level will accelerate the current correction momentum and drive a sharp fall towards $3,300.

On the contrary, if the coin buyers manage to hold this neckline, the Ethereum price would continue its sideways action to recoup the bullish momentum for the next leap.
