- On-chain trackers show ETH withdrawals are outpacing deposits on major exchanges, signaling a potential supply squeeze.
- Ethereum price drives the current recovery within the formation of a bull flag pattern.
- Cumulative netflows across exchanges have slipped to negative levels, the first time ever.
The crypto market kicked off October on a bullish note as investors sought its top assets as a safe haven amid the U.S. government shutdown. As a result, the Bitcoin price spiked to $118,000, and the Ethereum price jumped to $4,317. As the broader market recovers its bullish momentum, the second-largest cryptocurrency witnessed a historic supply as the amount of ETH leaving exchanges has surpassed its ability to accumulate it. Does the price data offer a suitable entry?
Ethereum Exchange Reserves Fall to Historic Lows
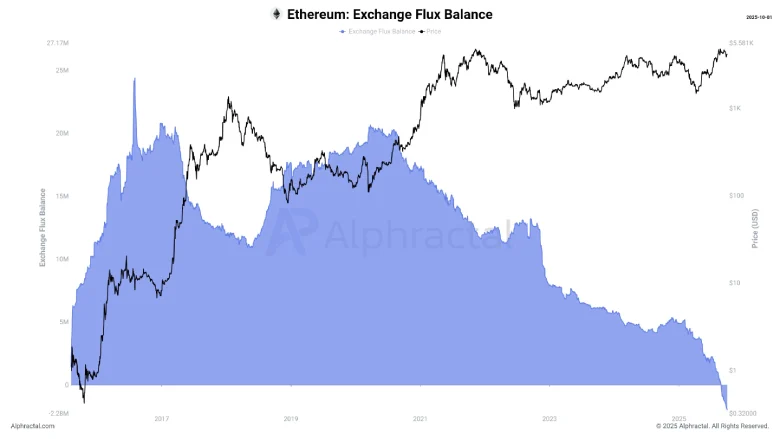
Ethereum is going through an unprecedented change in exchange supply dynamics, according to new data from on-chain analytics firm Alphractal.
Recent figures show the net movement of Ether (ETH) across all major exchanges moving into territory not previously recorded. For the first time, the coins are flowing out of trading venues faster than they are flowing in. The trend is represented both in terms of the raw numbers of ETH withdrawn and the dollar value attached to those withdrawals, amounting to billions of dollars in recent months.
One of the most important gauges featured in the data is the “Exchange Flux Balance,” which is a cumulative measure of exchange inflows versus outflows. When the indicator is higher, it indicates that the trading platforms are able to accumulate and store coin reserves. On the other hand, low values indicate that users and institutions are withdrawing assets faster than exchanges can replenish them.
This month, the balance went into negative territory — a break from the longstanding pattern of exchanges holding a net surplus. Analysts point to a structural shortage emerging in available liquidity on trading platforms as the cause of the downturn.
The backdrop suggests an increased accumulation outside of exchange wallets, indicative of a growing long-term positioning. The movement is consistent with institutional custody adoption and the high demand from private holders of shifting assets to ensure storage.

With exchange balances thinning at a record pace, the circulating supply of Ethereum on public trading venues has fallen to new lows, creating conditions not seen in Ethereum’s history.
Ethereum Price Extends Recovery Within Flag Pattern
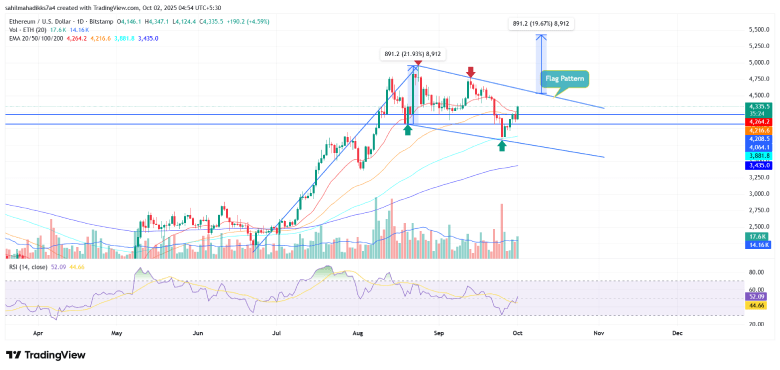
In the last two weeks, the price of Ethereum registered a recovery from $3,820 to $4,316, accounting for a 13% growth. The flash crash from liquidation is outpaced by continued accumulation from large players, institutions, and ETF inflows.
According to the technical chart, the reversal is also positioned at a high area of interest, i.e., the bottom trendline of a full-fledged pattern. Theoretically, the chart setup displays a long, ascending trendline denoting the dominant buying force in the market, followed by a short correction to recuperate the exhausted bullish momentum for the next leap.
With an intraday gain of over 4%, the Ethereum price managed to breach the $4,268 resistance and reclaim key, daily exponential moving averages 20 and 50. With sustained buying, the coin price would rise another 4.5% and challenge the flagged resistance at $4,500.
A potential breakout from this resistance will accelerate the bullish momentum and signal the end of the ongoing correction. The post-breakout rally could push the price for a sharp 20% and hit a new high of $5,400.

On the contrary, if sellers continue to defend the overhead boundary of the flag, the current consolidation could extend into the later part of October.


