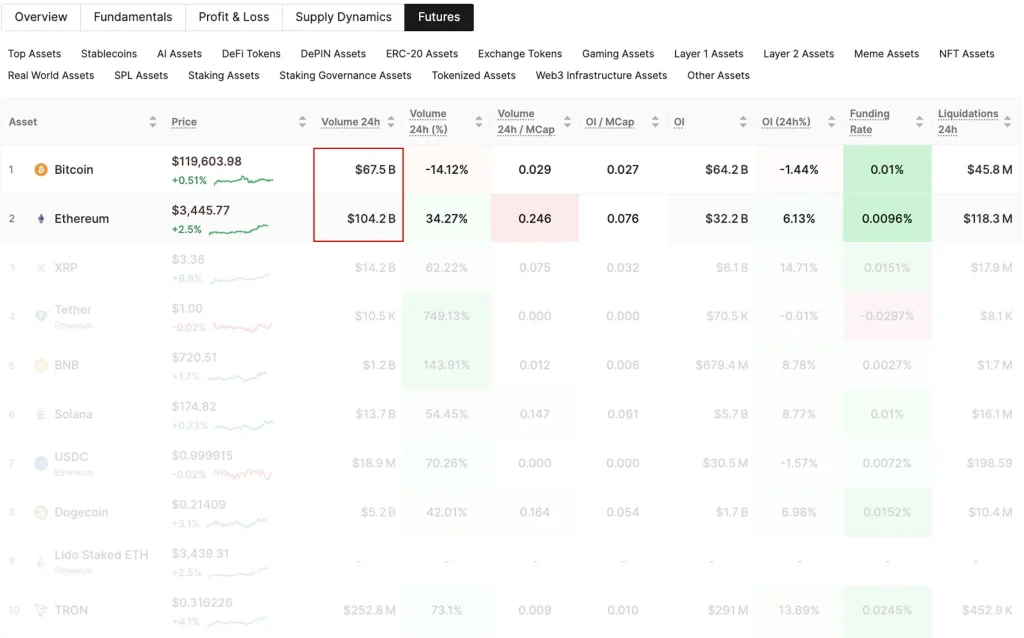
According to the on-chain analytics firm Glassnode, Ethereum’s futures have again overtaken Bitcoin in terms of 24-hour trading volume, indicating a change in market sentiment and increased speculative activity. Within the same timeframe, the cryptocurrency’s futures posted a volume of 104.2 billion compared to that of Bitcoin, which was almost 1.5 times less, at 67.5 billion.
This was a 34.27% growth in Ethereum’s futures trading, as opposed to a 14.12% decrease in Bitcoin. In addition to the volume increase, the token’s Open Interest (OI) increased by 6.13% to 32.2 billion, which means that new positions were added. On the contrary, Bitcoin’s OI declined by 1.44% to $64.2 billion.

Crypto Futures Market (Source: X Post)
The rise in ETH OI, coupled with a modest funding rate of 0.0096%, implies that the growth in leveraged positions is healthy and not overheating yet. Analysts consider such conditions to lead to a long-term bullish period. In the meantime, Bitcoin maintains a more elevated spot rate of $119,603.98 and a stable funding rate of 0.01%.
Nevertheless, its lower liquidation amount ($45.8M vs. ETH’s $118.3M) can be considered to be reduced speculative pressure and short-term volatility compared with Ethereum. Glassnode views this ecosystem as being more Ethereum-friendly, with the rotation of capital into ETH derivatives perhaps being in anticipation of specific price catalysts.
Ethereum Technical Setup Hints at 3x–4x Price Surge
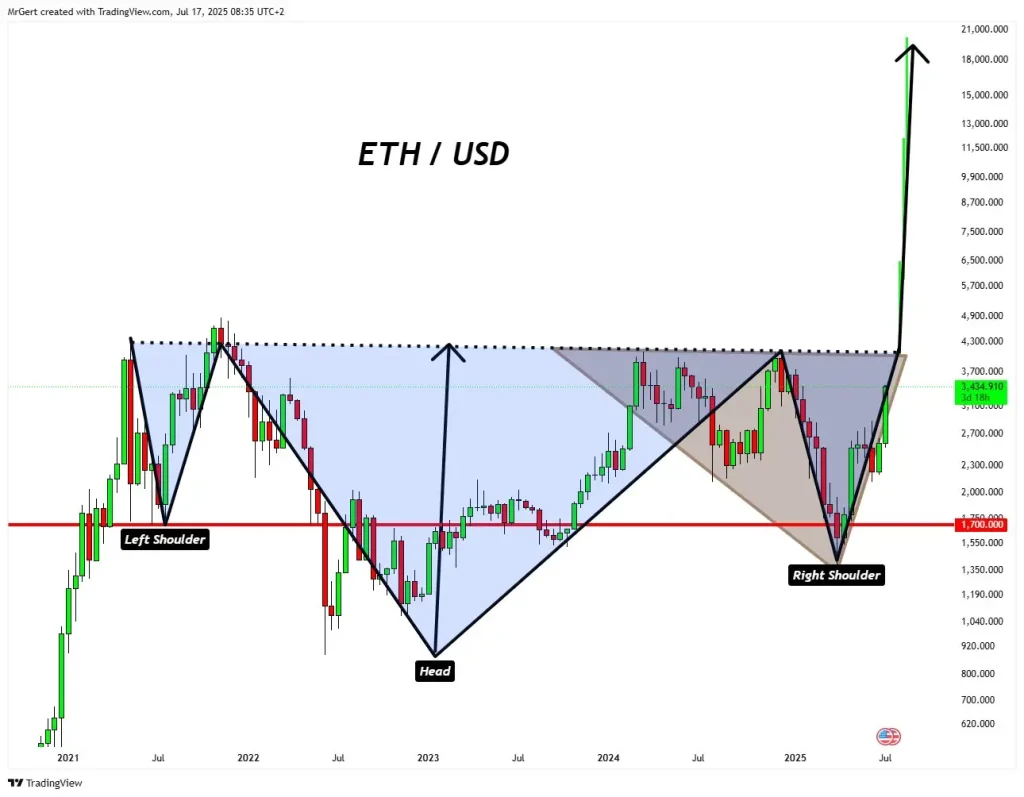
With this powerful on-chain momentum, technical analysts have started to map out price formations that favor a large upside swing in the ETH token. Market analyst Gert van Lagen is one such example, having spotted a huge inverse four-year Head and Shoulders pattern on the weekly chart of Ethereum, a bullish pattern that is usually indicative of trend reversals.
The pattern shows clean symmetry between the left and right shoulders and a neckline forming near $4,300. Based on the measured move from the head to the neckline, van Lagen projects a long-term target of $20,000. He also emphasizes that recent liquidations flushed out overly leveraged positions built around the September 2023 lows, reinforcing the bullish potential by resetting retail positioning.
Ethereum Price Chart (Source: X Post)
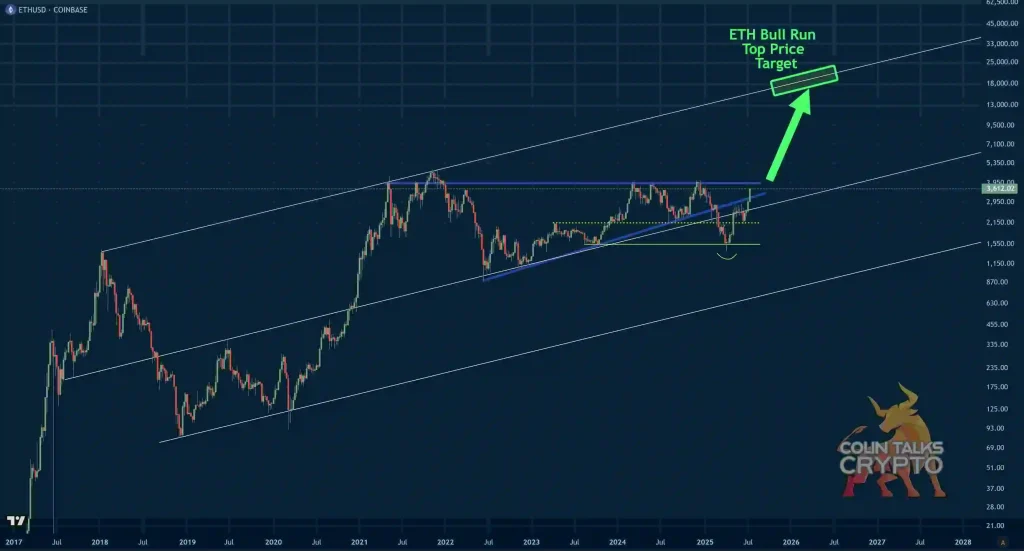
In agreement with this sentiment, analyst ColinTCrypto believes that the Ethereum cryptocurrency will surpass Bitcoin in this bull market as it is a high-beta asset. He points out that the smaller market cap and higher volatility of the ETH token are the reasons that will facilitate more aggressive rallies, but with sharper corrections after the cycle.
Ethereum Price Chart (Source: X Post)
Colin’s price target also sits in the $15,000 to $20,000 range, aligning closely with van Lagen’s technical projection. He adds that this would mark a 3x-4x increase on the previous all-time high of $4,800 of ETH and would fall in line with long-term trendline resistance, further lending credibility to the prediction.
Although volatility continues to be one of the most characteristic aspects of Ethereum market dynamics, the correlation between on-chain statistics and long-term technical configurations indicates a possible substantial price breakout within the next several months.
Read more: Ethereum Nears $2K Breakdown, Staking Growth Signals Recovery


