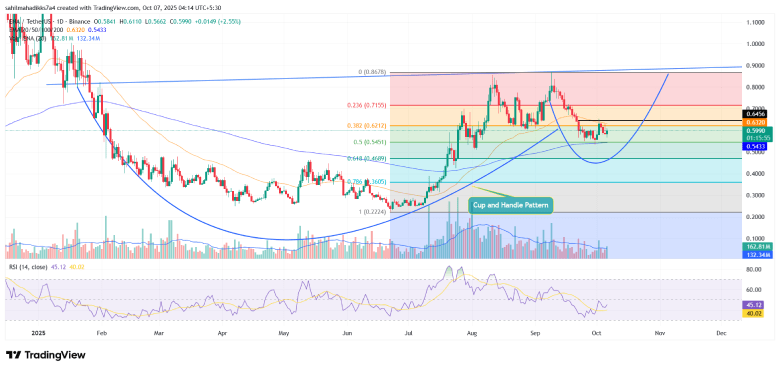
- The Ethena price daily chart shows a major accumulation trend amid the formation of a cup and handle pattern.
- A 17% surge in open interest suggests more traders are opening new positions in ENA’s future contract in anticipation of a dynamic move.
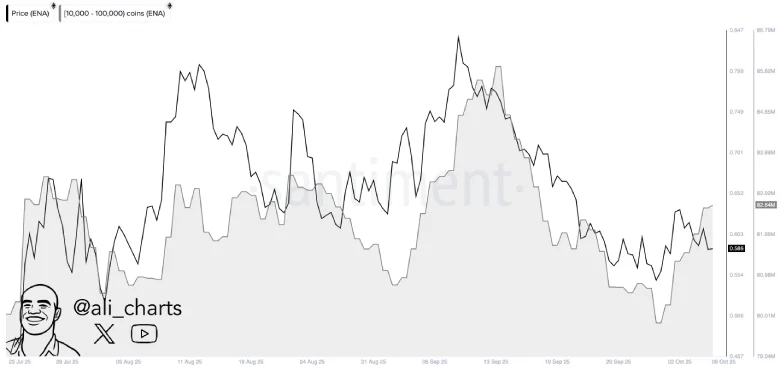
- On-chain data highlights that large investors in ENA were in the recent market dip.
- A confluence of the 200-day exponential moving average and 50% Fibonacci retracement level at $0.55 creates a strong support ENA price.
ENA, the cryptocurrency of the synthetic dollar protocol Ethena, jumped over 3% in Monday’s market trading. The move aligns with Bitcoin hitting a new high of $126,000 amid the ‘Uptober’ sentiment. While the majority of altcoins follow this momentum, Ethena struggles to hold above the $0.65 mark, resulting in short-term consolidation. However, the renewed speculative activity in the derivative market and a surge in whale accumulation suggest that the ENA price could be next to give a breakout.
Whale Moves, Derivatives Spike Show Growing Faith in Ethena
In the first week of October, the crypto market witnessed a significant inflow and renewed recovery in the majority of major cryptocurrencies. Despite the bullish sentiment, the Ethena price struggles to surpass the overhead supply pressure at $0.6, evidenced by the long-tail rejection candle on the daily chart.
While the price of travel sides, ENA records renewed activity in the futures market. Open interest in Ethena-linked futures has surged dramatically over the last week, from around $1.02 billion to $1.12 billion, according to Coinglass data. The 17% increase shows renewed speculative activity around the protocol’s native token, ENA.

At the same time, large holders seem to have increased their ENA purchases. Market analyst Ali Martinez highlighted that whale addresses have collected around 2.8 million ENA over the same period. This increase has coincided with a noticeable rise in ENA’s market value, suggesting a surge in participation by institutional or long-term investors.

The parallel increase in derivatives positioning and accumulation on-chain indicates that traders are increasing exposure to the asset after a sharp correction in September’s second half.
Ethena Price Poised For Major Upswing Within Bullish Pattern
The recent correction trend in Ethena price has shifted its trajectory sideways above the $0.55 floor. The 200-day exponential moving average is currently coinciding with the aforementioned support, indicating the broader trend in this asset price. Moreover, the price also holds above the 50% retracement level, indicating the recent correction could allow buyers to recoup bullish momentum.
Furthermore, an upward swing in the momentum indicator RSI accentuates the rising buying pressure. As a result, the Ethena price is uplifted to $0.6 trading value, while its market cap wavers around $4.29 billion.
Thus, the ENA price could surge 7.71% higher and challenge the overhead resistance at $0.65. A potential breakout from this barrier would signal the end of the recent correction and potential for a renewed recovery. The post-breakout rally could push the price another 34% as it develops the handle portion of the traditional reversal pattern cup and handle pattern.
The chart setup is commonly spotted at the end of a major downturn, as its cup shape reflects a long accumulation trend in price. A bullish breakout from this resistance is key for ENA buyers to enter a sustainable uptrend.

On the contrary, if sellers continue to defend the $0.86 neckline, the current sideways trend could prolong into the later months of 2025.
Also Read: AI and Big Data Tokens on Fire: Render, Bittensor, Injective Lead


