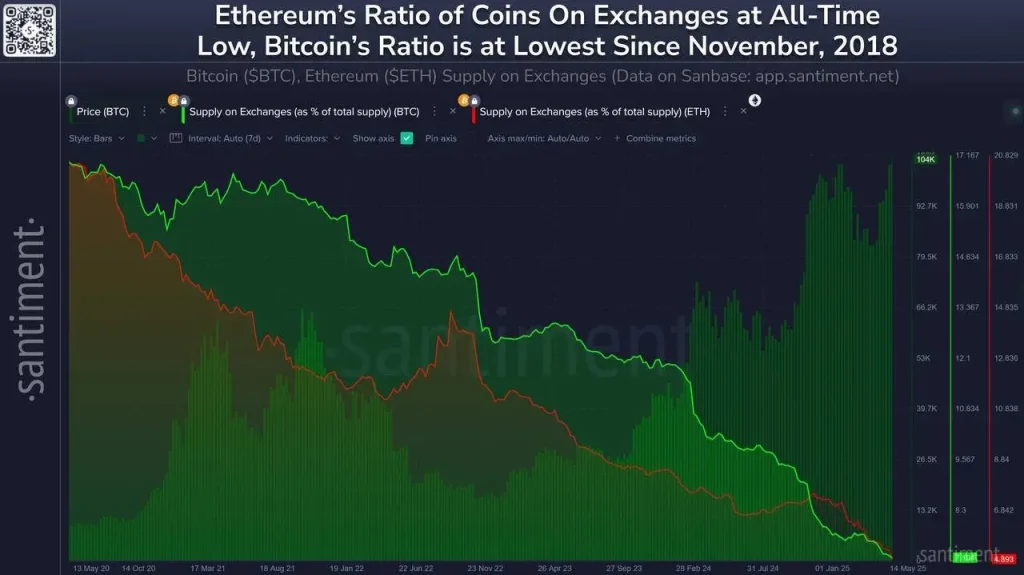
ETH supply on exchanges has plummeted to an all-time low, with less than 4.9% of the total circulating supply currently held on trading platforms. Like the other cryptos, Bitcoin (BTC) also shows this drop; its exchange-held supply dropped to 7.1%, a level not seen since November 2018.
Market analyst Kralow says these numbers point to something more than just changes in cost, pointing out that the trend indicates the crypto markets are tightening. The data, visualized in a chart from Santiment, confirms this deep liquidity contraction. Since early 2021, the ratio of ETH and Bitcoin price predictions on exchanges has declined sharply.

ETH Ratio of Coins on Exchanges (Source: X Post)
Ethereum’s drop has been particularly steep, reflecting a continuous exodus of coins from centralized platforms, possibly to cold storage or staking solutions. Bitcoin’s ratio dropped, too, though a little smoother, but it has now lined up with Ethereum’s trendline.
A decrease in the number of cryptos could bring essential changes to the market. When coins transfer out of exchanges, the effort to sell them decreases, so rising demand may cause prices to climb. As a result, the structure Kralow highlights could mark a pivotal shift in traders’ interpretation of token availability and Ethereum price prediction.
Structural Tightening Meets Technical Strength: ETH Targets $10K
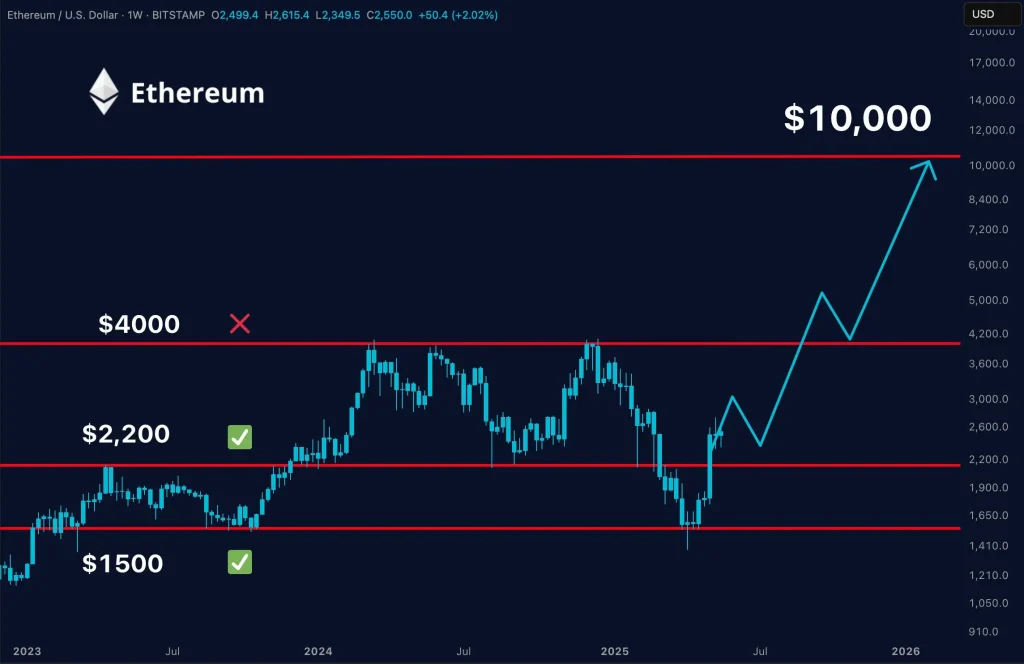
Merlijn The Trader says that Ethereum’s current low on exchanges boosts the coin’s technical ascent. According to Merlijn, the cryptocurrency has decisively cleared key resistance zones at $1,500 and $2,200 levels, which he states were “obliterated”—and is now trading above $2,600 with renewed strength.
Yet, Merlijn’s chart analysis highlights $4,000 as the next major resistance zone, which he dubs the “final boss” before ETH can enter true price discovery. Even with previous cycles showing no success, the token’s buildup and shortened supply could give the token the boost it needs to rise above this level.
While the $4,000 level has historically rejected upward momentum, the token’s rebound from its $1,500 lows and solid hold above $2,600 marks a notable shift in market dynamics. Merlijn is looking at a target of $10,000 over time, saying that a break above $4,000 could take prices up much faster.
With both on-chain and technical indicators aligning, analysts are watching closely to see if the cryptocurrency’s tightening market structure will be the catalyst that transforms resistance into liftoff.
Also Read: Will SUI Price Lose $3 Support After $220M Cetus Hack?


