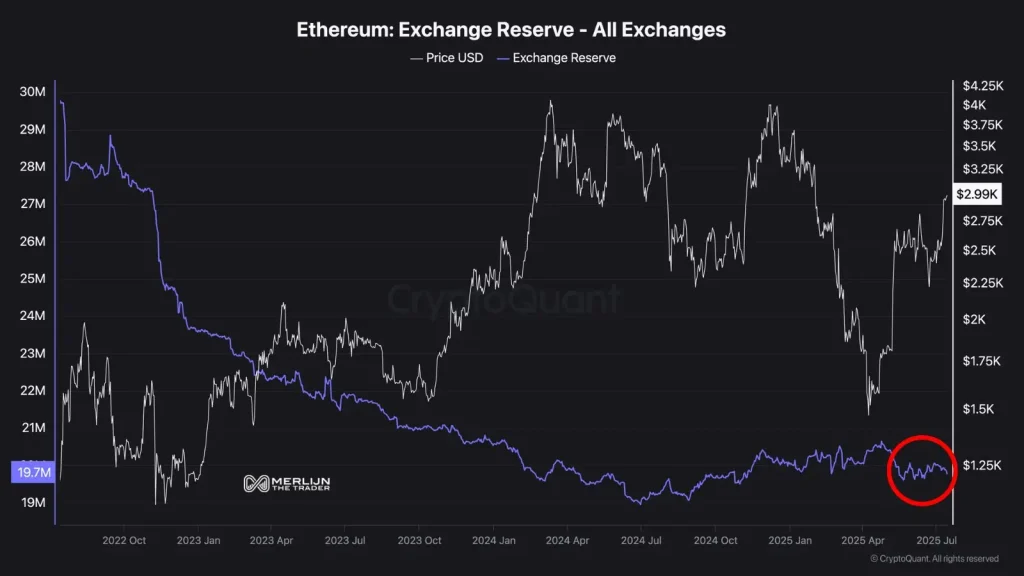
Ethereum (ETH) reserves on centralized exchanges have dropped to 19.7 million—their lowest since 2020—signaling a tightening supply as market momentum picks up. Crypto analyst Merlijn The Trader marked out the sharp drop, implying that the declining supply of ETH may generate upward pressure on prices with an increase in demand.
Ethereum Supply Hits 5-Year Low, Price Nears $3K
Using on-chain data from CryptoQuant, Merlijn references a rapidly dropping supply trend on all exchanges, illustrated by the ever-declining blue line denoting exchange reserves. Over the past three years, Ethereum reserves have fallen steadily from nearly 30 million to just 19.7 million, while prices have shown increased volatility and upward pressure in response.
“This isn’t just a number,” Merlijn tweeted. “It’s a warning shot,” referring to the compounding effects of decreasing supply and growing demand. He noted that demand is beginning to heat up while supply continues to vanish—a combination that has historically preceded major price rallies.

ETH Exchange Reserves (Source: X Post)
Practically, the chart shows Ethereum’s price (white line) trending upward recently, approaching the $3,000 mark, while reserves continue to decline. This inverse correlation, wherein price increases when supply decreases, buoys the bullish view expressed by the analyst.
Merlijn emphasized that with less ETH available on exchanges, the token becomes harder to acquire, increasing scarcity and placing upward pressure on price. While the cryptocurrency is not yet at its all-time highs, the technical breakout and tightening supply suggest a momentum shift that could push the token past $4,000 if the trend continues.
Whales Scoop Up ETH, Hinting at Looming Breakout
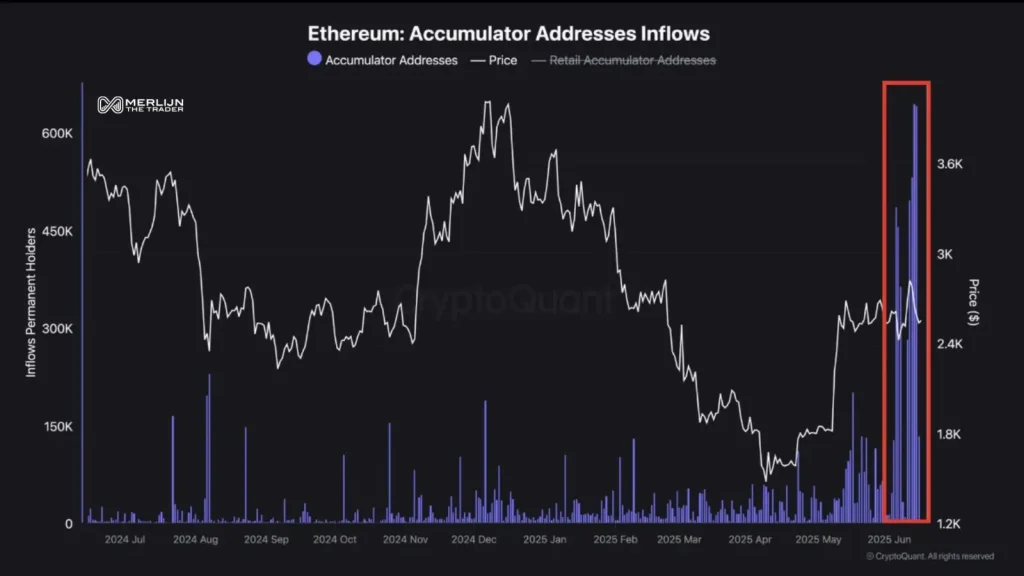
In a separate but related analysis, Merlijn pointed to an intense wave of buying from “accumulator addresses,” or permanent holders. His chart shows a sudden spike in inflows to these addresses, levels not seen since Ethereum’s 2020 accumulation phase, just before the previous bull run. “The $ETH whale signal has flashed,” he noted, attributing the activity to coordinated accumulation by large holders.
ETH Accumulator Addresses Inflows (Source: X Post)
From mid-2025 onwards, inflows from accumulator wallets have surged dramatically, even as the price hovered between $1,800 and $2,600. This deviation, in combination with a sudden decline in the supply of liquid exchange, signals an imminent supply shock. Merlijn defines the momentum as “whale-coordinated action” that may serve as a transition to the next Ethereum parabolic advance.
ETH 50 MA Breakout Mirrors 2020 Bull Run Setup
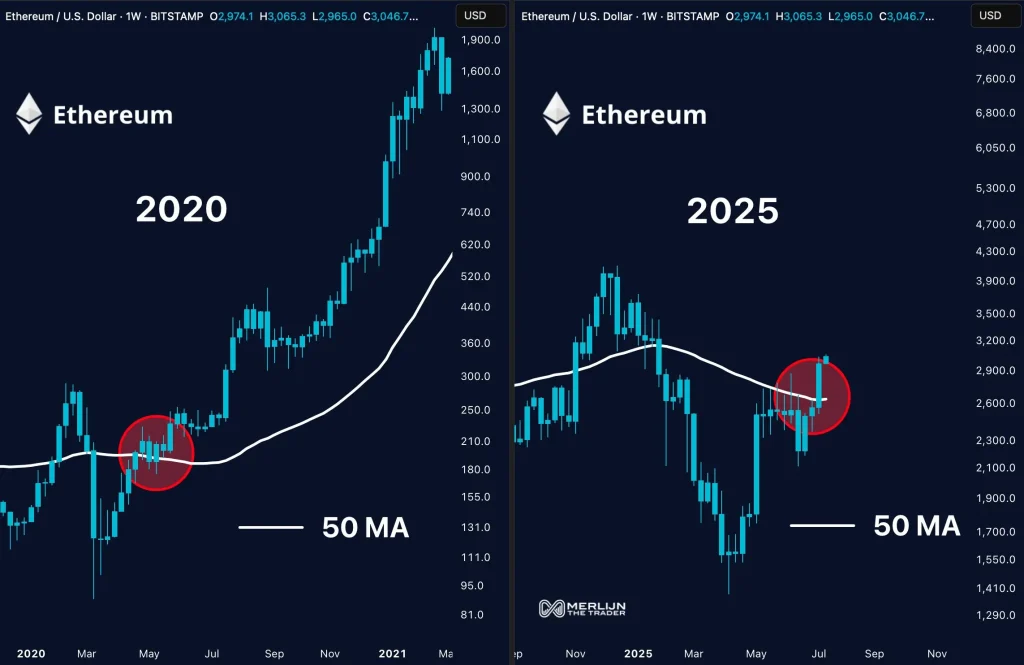
Adding to the on-chain bullish case, Merlijn The Trader pointed out a striking technical formation that strongly resembles the Ethereum breakout in 2020. In a side-by-side chart comparison, Merlijn pointed out how altcoin’s recent move above the 50-week moving average (50 MA) in 2025 is nearly identical to the pattern seen in early 2020, just before Ethereum launched into a historic multi-month rally.
In both cases, ETH regained equilibrium around the 50 MA and then broke upward with major momentum on the weekly chart. The 2020 breakout saw the start of the token’s run from under $250 to $4,000+. Fast-forward to 2025, and ETH has printed the same breakout scenario once again, reclaimed the 50 MA with a robust weekly candle, and sits in the 3,000 zone.
Ethereum Price Chart (Source: X Post)
As Merlijn tweeted, this arrangement may characterize the whole altseason, suggesting the technical framework may be the driver of a new parabolic movement. Besides, the significance of the 50 MA in the longer-term momentum movements emphasizes the idea that such a breakout can be an attractive factor to even further buying momentum, especially as the overall market tone is turning more bullish.
With on-chain and technical indicators aligned, Ethereum might be primed for a major breakout as witnessed in 2020.


