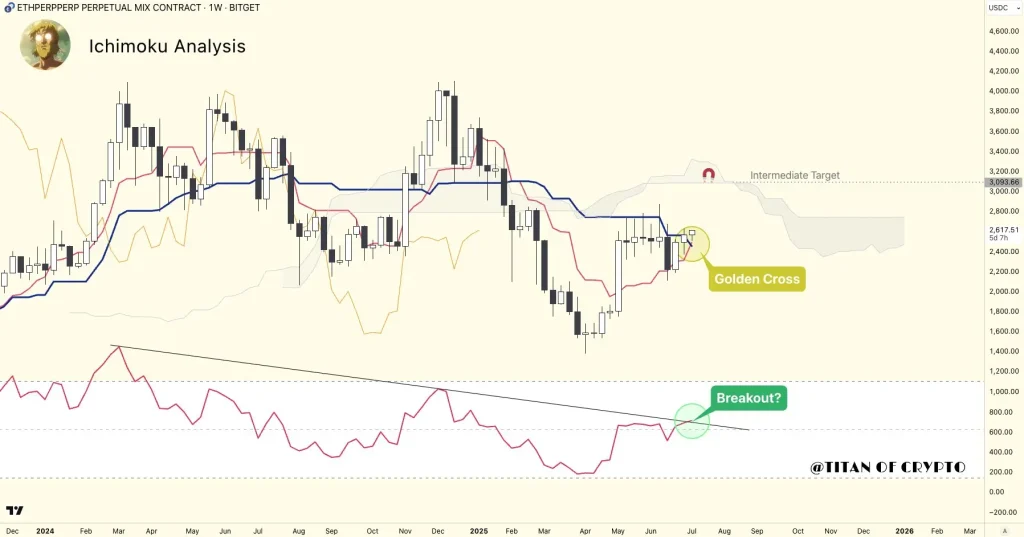
In a fresh analysis of ETH’s weekly chart, crypto analyst Titan of Crypto points to a significant technical development: an Ichimoku Golden Cross — a rare and potentially explosive signal that often marks the start of a strong uptrend.
This “Golden Cross” forms when the Tenkan-sen (conversion line) crosses above the Kijun-sen (baseline), indicating a shift in market momentum from bearish to bullish. And it’s happening just as Ethereum starts nudging higher near the Ichimoku cloud, which acts as a zone of resistance. A clean break above it could clear the skies for a major rally. For a more comprehensive outlook, check out our full Ethereum price prediction to explore where ETH could head next in both the short and long term.

ETH Price Chart (Source: X Post)
But that’s not all. The RSI (Relative Strength Index), a popular momentum indicator, is flashing its bullish clue. After months of drifting lower under a downtrend line, the RSI is now pushing through that resistance — a move that could signal a surge in buying strength.
If this setup holds, Titan of Crypto believes Ethereum could be heading straight for $3,100 — a price zone marked as the next “intermediate target.” With the token currently hovering around $2,617, that’s a potential 19% jump from current levels.
ETH Cost Basis Data Points to Solid Floor
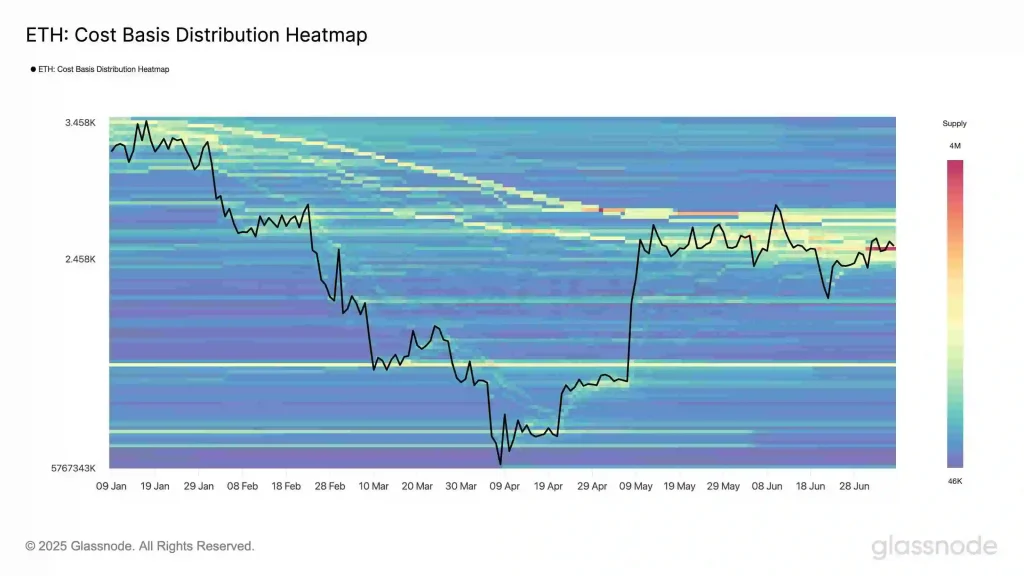
Building on this bullish insight, ETH’s price range around $2,513–$2,536 has quietly transformed into one of the most critical zones of on-chain activity in recent months. As Glassnode notes, over 3.45 million ETH now holds a cost basis within this tight band, revealing that a significant portion of the market sees this level as “fair value.”
In simple terms, it’s a high-conviction area for investors and a potential anchor of price stability. Notably, the chart’s vibrant yellow and red bands in that region indicate a dense clustering of supply, where many investors have historically entered the market.
ETH: Cost Basis Distribution Heatmap (Source: X Post)
This forms a solid on-chain support level, as holders in profit are less likely to sell aggressively near their break-even point, and new buyers often view such zones as attractive re-entry points. What makes this range even more compelling is how the price (represented by the black line) continues to orbit it.
Since May, the ETH cryptocurrency has consolidated mainly above $2,500, repeatedly bouncing off this level — a technical validation of the same region that Glassnode’s data now confirms through on-chain behavior. If momentum builds from here, $2.5K may be remembered not as a ceiling, but as the launchpad.


