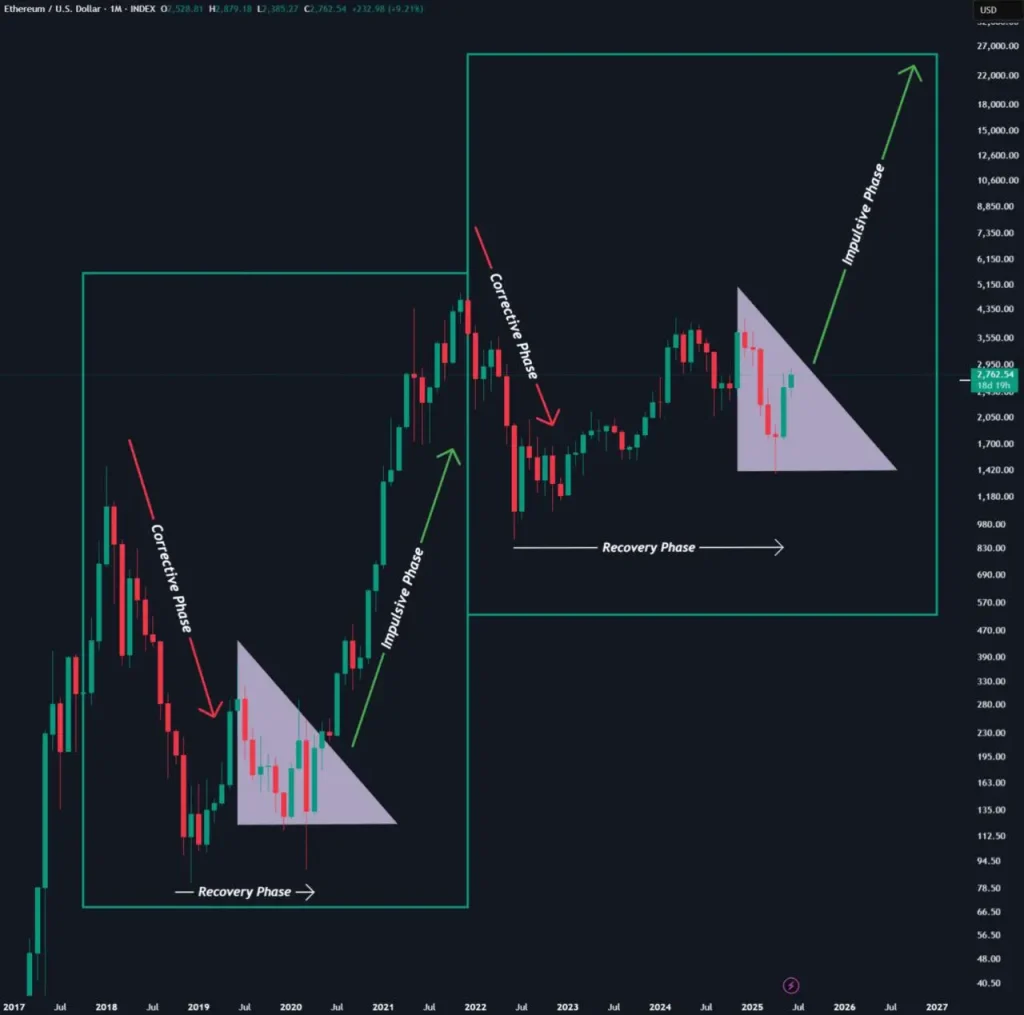
Based on a chart and tweet information provided by analyst Abbé, Ethereum (ETH) is in the second phase of a three-stage market cycle. Abbé argued that ETH historically goes through a corrective phase, then a recovery phase, and finishes with an impulsive phase of sharp upward price behavior.
Abbé’s analysis identifies the current market cycle as having already completed Phase 1 (Corrective) and having entered Phase 2 (Recovery) since early 2023. Its monthly candlestick formation displays a consolidation phase in the form of a descending triangle, reminiscent of the last cycle in 2019-2020.
The analyst notes that the ultimate shift into an impulsive phase (Phase 3) should start as soon as the token closes a monthly candle above the crucial resistance at $3,000. In the previous cycle, the cryptocurrency experienced a similar structural breakout after its recovery phase, leading to a decisive rally that peaked above $4,800 in late 2021.

ETH Price Chart (Source: X Post)
Abbé projects that a similar impulsive breakout could occur in the current cycle. His chart visually projects potential price levels significantly higher, possibly reaching above $20,000 and beyond if the historical pattern holds.
ETH Fractal Repeats: Bigger, Faster, Stronger, Analyst Warns
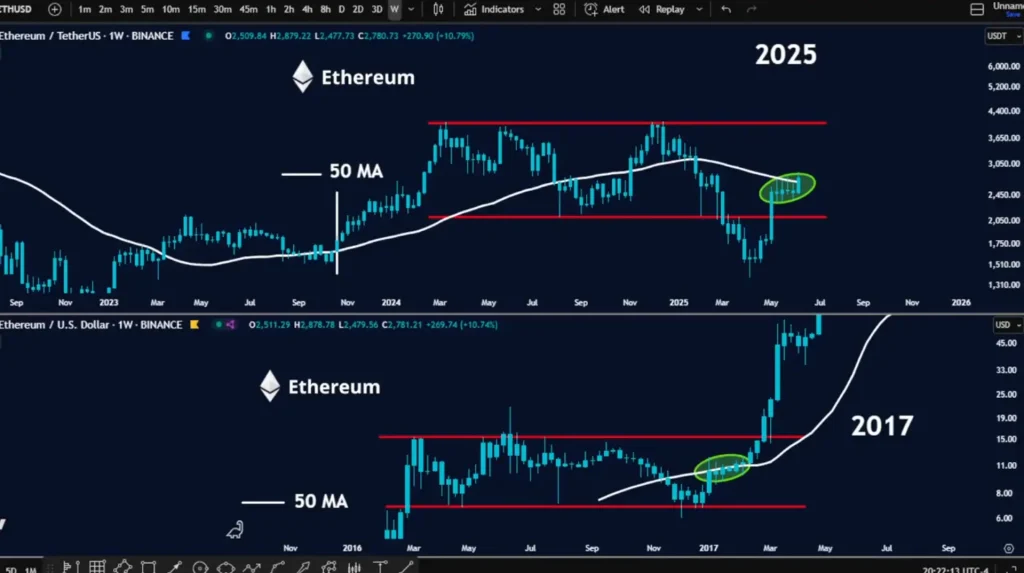
Crypto analyst Merlijn The Trader further reinforces the bullish thesis outlined by fellow analyst Abbé. According to Merlijn, Ethereum (ETH) is replicating its 2017 price action with striking similarity, setting the stage for a potentially explosive breakout.
In a comparative chart shared on X, Merlijn outlines a “bar-for-bar” alignment between the token’s current 2025 weekly chart and its 2017 breakout structure. Both of these charts feature a decisive move above the 50-week moving average (50 MA) following a prolonged accumulation phase.
ETH Price Chart (Source: X Post)
The chart highlights two nearly identical technical setups: in 2017, the altcoin broke out after reclaiming the 50 MA and consolidating just beneath major horizontal resistance. This move triggered a vertical rally that took the asset from around $10 to over $45 within weeks.
As of June 2025, the ETH token is again pressing against the same type of structure, hovering near $2,800 with the 50 MA acting as dynamic support. The current chart shows consolidation beneath horizontal resistance near $4,000, mirroring the final phase before the historic 2017 breakout.
Merlijn adds that the patterns are similar, but the current market contains much more liquidity and volume in trades, and therefore, any move up could be magnified. He continues, saying that the breakout may be explosive, not only due to technical similarities but also due to better market conditions. He says that the cryptocurrency at this point has a “bigger engine” and “no brakes.”
Smart Money Loads Up on ETH, Retail Flatlines
Such a bullish structure is also backed by on-chain metrics provided by IntoTheBlock, as whale accumulation has risen significantly in the last 30 days. Whales, addresses with considerable ETH balances, have accumulated +2.05%. In contrast, investor-level wallets have reduced their supply by -2.70%, which is a redistribution of the supply in favour of the larger holders.
ETH Historical Concentration (Source: IntoTheBlock)
Participation in retail has been relatively steady, with a slight increase of +0.02%. This change of hands indicates that the larger market players, generally regarded as smart money, are increasing confidence and are setting up for a possible breakout.
This supply concentration of ETH in more aggressive hands has been associated with major price movements in the past. This adds weight to the broader argument that Ethereum may be on the cusp of beginning a new impulsive phase.
Also Read: Top Analyst Reveals 3 Powerful Scenarios for Bullish XRP


