After weeks of steady gains, Ethereum (ETH) has decisively triggered a bullish signal rooted in one of the market’s oldest playbooks: the Wyckoff method. The shift, verified later in July, has analysts now targeting an upward explosion to $6,000 and beyond, supported by both chart pattern and on-chain activity.
ETH Technical Setup Aligns with Wyckoff’s Final Phase
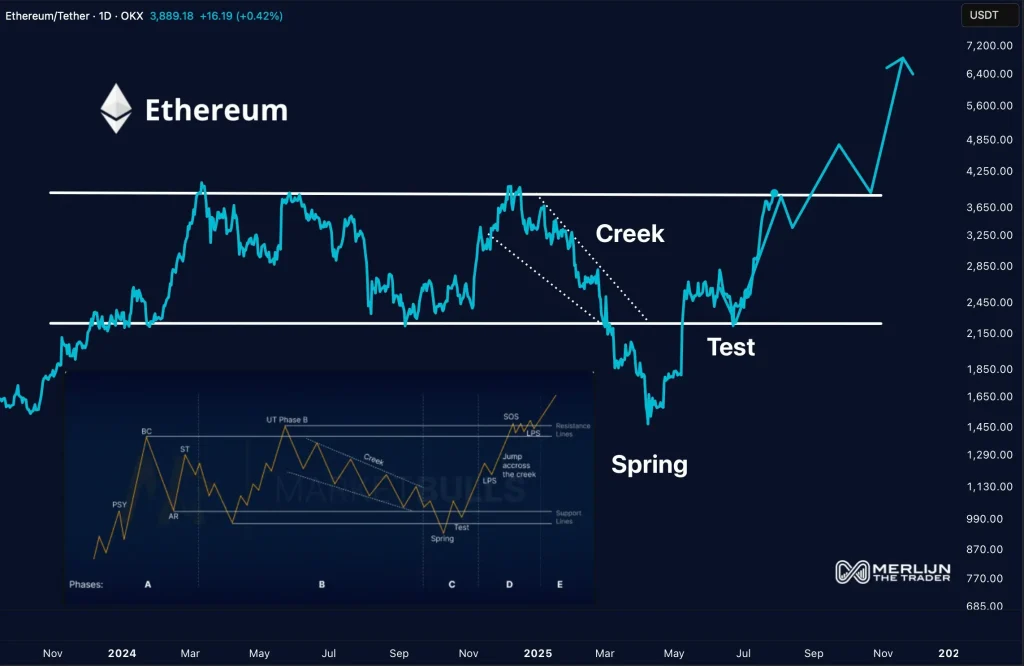
Technical analyst Merlijn believes the cryptocurrency has executed the Wyckoff accumulation pattern “to perfection.” According to his analysis, Ethereum completed its “Spring” and “Test” phases and has now broken above the key resistance zone—the “Creek”—around $3,850.

ETH Price Chart (Source: X)
That break signals the start of the “Markup Phase,” a stage in the Wyckoff model that often precedes explosive price moves. “Still waiting for confirmation? The market doesn’t wait for your comfort,” Merlijn wrote, projecting a target well above $6,000.
Supply Shrinks as Demand Grows
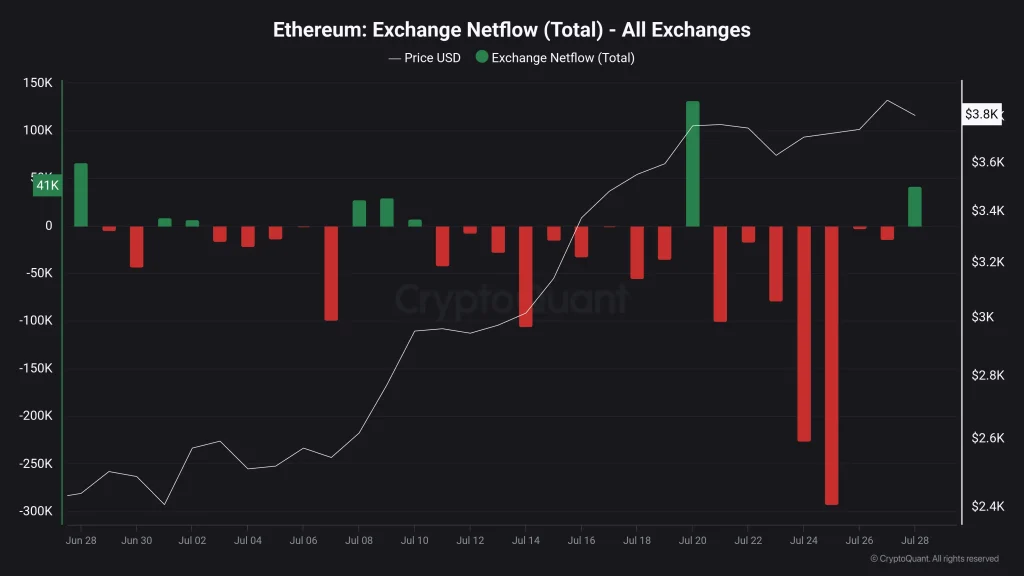
The bullish narrative is also reflected in on-chain data. Analyst Cas Abbé remarks that exchange balances have declined sharply, indicating that the token is being removed from exchanges and stashed off-market, a tell-tale sign of long-term accumulation.
ETH Exchange Netflows (Source: X)
In fact, on July 25 alone, more than 250,000 ETH flowed out of exchanges, marking one of the largest single-day withdrawals in recent months. “Supply squeeze is brewing,” Abbé noted. “Less $ETH on exchanges = bullish pressure building.”
With fewer coins available for trading and strong hands holding firm, ETH’s rally has a solid foundation. These trends align with our latest Ethereum price forecast, which also points to continued upward movement. This breakout is backed by the current price, which is above $3,880, showing that investors are more confident.
ETH Technicals Align for Sustained Upside
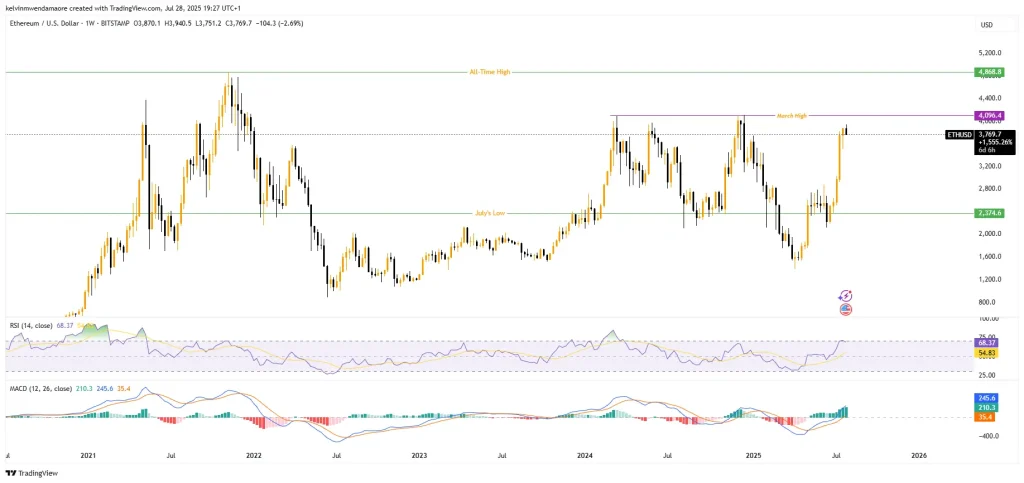
Further evidence of the breakout is the Ethereum weekly chart, which shows that ETH is poised to break a critical resistance around the March 2024 high near 4,096. This action comes after a steep rise of more than 55% since the July low of approximately $2,374.6. The rally has developed a pattern of higher lows and powerful weekly bullish candles.
ETH Price Chart (Source: TradingView)
Current price action suggests Ethereum may be breaking out of a multi-month consolidation range, with the next major resistance located at the all-time high near $4,868.8. Momentum indicators support the bullish setup. The Relative Strength Index (RSI) is at 68.37, just below the overbought level, indicating high buying power at the moment without yet signaling exhaustion.
Also, the MACD has entered the bullish zone as the MACD line is above the signal line, and the histogram bars are expanding positively, which is a sure indication of increased upward pressure. As long as ETH remains above its previous resistance, the current uptrend remains technically intact.


