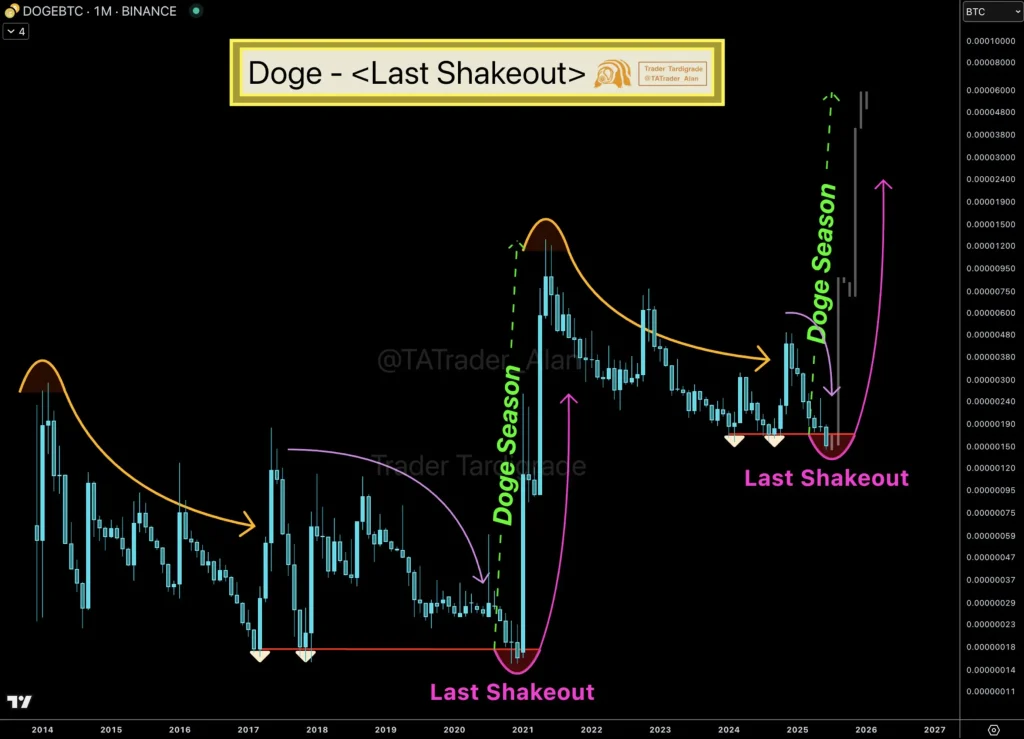
Dogecoin (DOGE) could be gearing up for a major comeback, according to technical analyst Trader Tardigrade. In his latest chart shared on TradingView, he highlights a familiar and potentially explosive pattern unfolding in the DOGE/BTC pair—something he calls the “Last Shakeout.”
DOGE Near Historic Support: Analyst Sees Rally Ahead
This “shakeout” is no random dip. Tardigrade identifies it as a classic bottoming signal that historically sets the stage for a Dogecoin rally. The chart draws parallels between past cycles and the current price action, showing how similar shakeouts in 2020 led to a massive surge, known as “Doge Season.” Now, with another shakeout forming in late 2024, he hints that history may be about to repeat itself.

DOGE Price Chart (Source: X Post)
The visuals tell a compelling story: the meme coin has been quietly carving out a rounded bottom on the monthly chart, stabilizing near long-term support between $0.00000120 and $0.00000150 BTC. From this base, past moves have launched explosively. If the pattern holds, another breakout may not be far behind.
Tardigrade’s analysis suggests we’re on the cusp of a second Doge Season—a period marked by sharp upward momentum against Bitcoin. With the technical structure aligning and sentiment slowly shifting, this could be Dogecoin’s moment to shine once again.
DOGE Shows Strength with 1H Trend Reversal
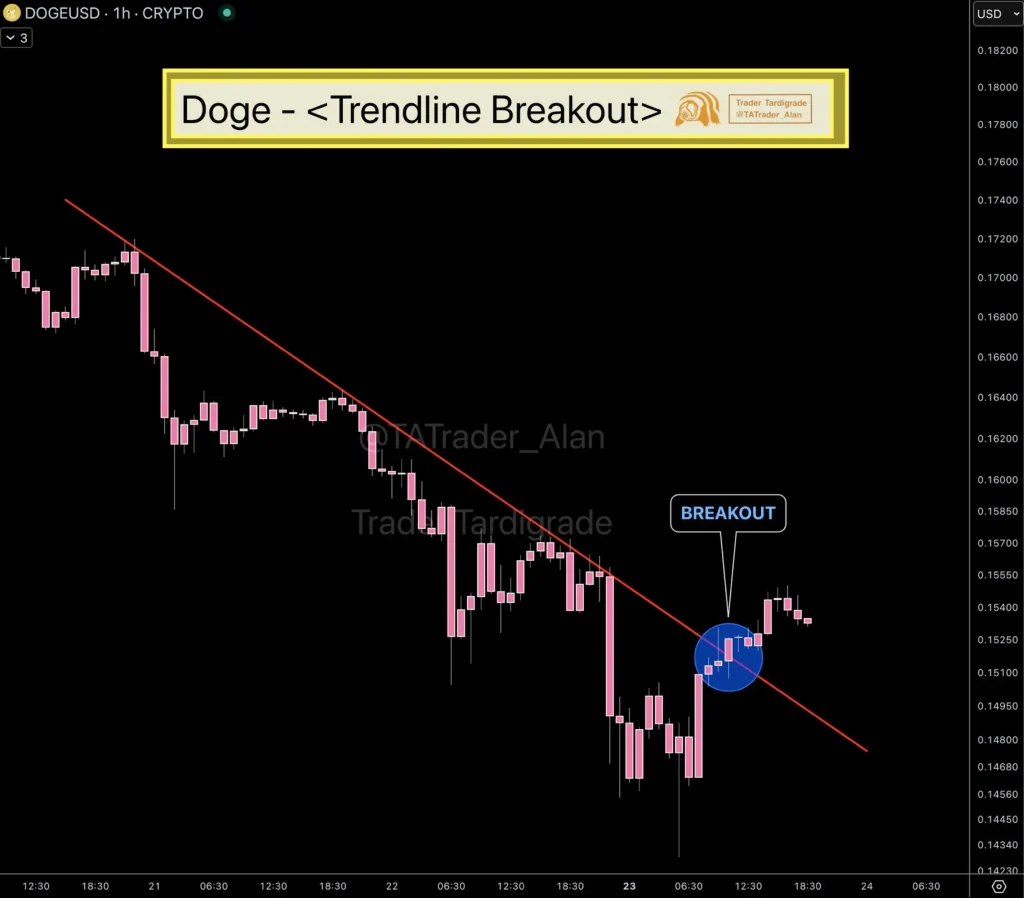
After the likely breakout presented by Trader Tardigrade, Dogecoin (DOGE) has surged over a significant falling trendline on the 1-hour chart. Such a move is a temporary change in the market structure following an extended downtrend, which represents an increase in bullish force in lower timeframes (LTF).
DOGE Price Chart (Source: X Post)
The breakout, popping out in blue indicators, was not a mere ticker; it coincided with a candlestick close above the resistance, indicating that bulls are ready to start flexing their muscles. According to the current price levels of DOGE between $0.154 and $0.156, all attention is drawn to whether this popular token will be able to reverse that breakout in terms of solid support or not.
The interest of this move is the timing. It fits into a bigger picture of a larger structure based on larger time frames, one telling of a possible full cycle reversal. In case this breakout gathers more momentum, the hourly change can be the fuse that ignites a much larger fire.


