


Key Highlights
- BTC price teeters at $80,000 support amid flag pattern formation.
- ETH price breakdown below $2,350 triggers the bearish continuation pattern— head and shoulders (H&S).
- XRP price continues multi-month accumulation trend as buyers defend the Inverted H&S pattern.
Crypto prices today remain under bearish pressure after notable selling pressure last week. BTC price returns to the psychological level of $80,000, and the XRP price holds above the monthly support of $1.26. However, the second-largest cryptocurrency, ETH, breaks below a key support near $2,350, signalling a risk of further correction in the altcoin sector. Market participants are now positioning for next week’s Federal Reserve policy decision.
Crypto Prices Today Remain Bearish Ahead of Fed Decision
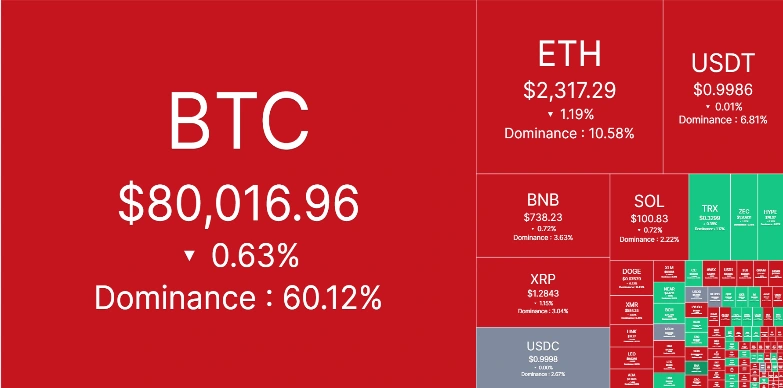
The global cryptocurrency market cap witnessed a 0.47% drop on Monday, October 26th, to reach $2.67 trillion. The selling pressure continues as follow-up market-wide selling pressure since last Thursday, following a notable pullback in U.S. technology stocks, renewed U.S.-Iran tensions and a wave of liquidation in crypto derivatives markets.
By press time, the BTC price shows a 0.63% drop since yesterday to trade at $80,011, ETH price records a 1.19% fall to hit $2,317, and XRP takes a 1.15% dive to reach $1.28. Other major altcoins like Solana and BNB plunged roughly 0.7% to trade at $100 and $738, respectively.
Crypto investors are closely watching the upcoming Federal Reserve policy meeting on October 27–28. Following a surprise 25-basis-point rate hike in September—the Fed’s first increase in over three years—the target federal funds rate currently sits at 3.75%–4.00%.
While the macroeconomic consensus points to a rate pause this week, the crypto market is bracing for a distinctly “hawkish pause” led by Fed Chair Kevin Warsh. With “higher-for-longer” interest rates driving 10-year U.S.
Treasury yields toward the critical 5% threshold, capital is increasingly shifting away from spot crypto markets and high-risk corporate structures toward safer fixed-income assets.
BTC Price Retail Bullish Hope with Flag Pattern
The BTC price continues to resonate within two horizontal trendlines since late September. This consolidation resembles the formation of a classic bullish continuation pattern called the bull flag.
Amid the current recovery trend, Bitcoin is frequently showing such short consolidation to recoup its bullish momentum before the next move.
Currently, BTC holds above the $80,000-$79,000 support zone, with a long-tail rejection candle showing intact demand pressure. If the buyers continue to defend the lower trendline of the flag pattern, the coin price could bounce roughly 7.5% to challenge the upper trendline at $86,000.
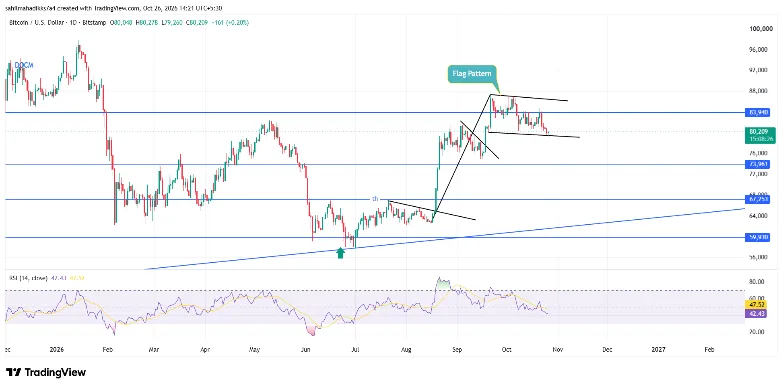
A bullish breakout from this resistance is key for Bitcoin buyers to drive a sustainable recovery above $90,000.
ETH Price Gives Bearish Breakdown from Head and Shoulders Pattern
Over the past two months, the ETH price traded in a sideways range above the $2,350 support. This consolidation showcased three failed attempts by price to surge above $2,800, resulting in the formation of a head and shoulders pattern.
This is a classic bearish reversal pattern that promotes selling pressure on prices. Last Sunday, the ETH price gave a decisive breakdown below the pattern’s neckline support of $2,350, signalling the start of a prolonged correction.
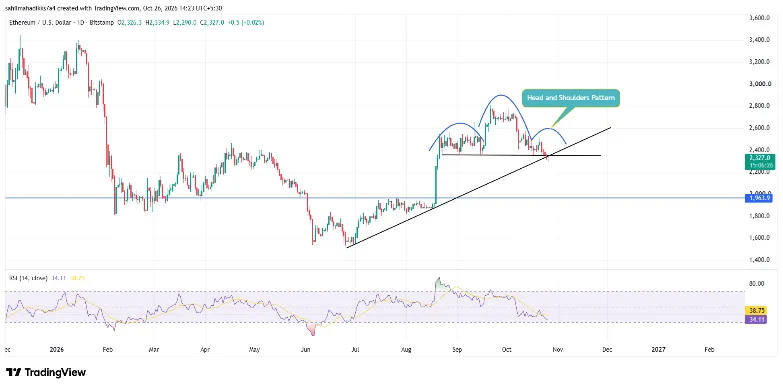
If Ethereum coin holds this breakdown, the sellers could drag its price to the $1,963 floor.
XRP Maintains Long-term Accumulation Under Inverted Head and Shoulder Pattern
Similar to BTC and ETH, the XRP price shows a narrow consolidation between the $1.6 and $1.2 horizontal levels. However, the lateral move is a small part of a bigger sideways trendline that develops the inverted head and shoulders pattern, as shown in the chart below.
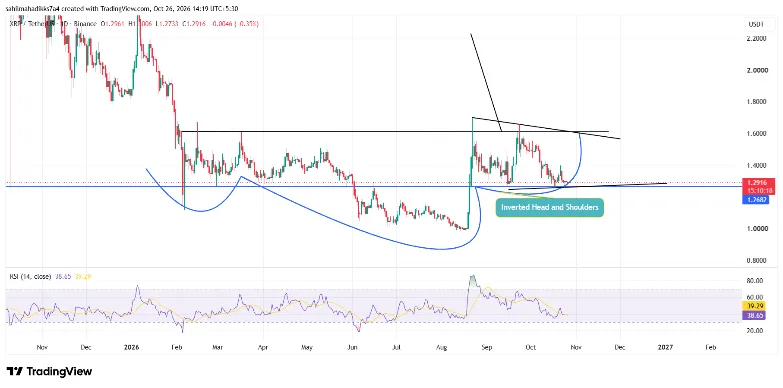
The chart is commonly spotted at the bottom of a downtrend and supports increasing demand pressure in an asset. The XRP price currently holds the $1.26 base support of its right shoulder. A bullish reversal from this floor could push the XRP price 24% up to hit $1.61.
An upside breakout from the pattern’s neckline resistance would accelerate the bullish momentum in XRP price to remain above the $2 mark.