


ADA, the native cryptocurrency of the layer-1 blockchain Cardano, jumped 1.2% during Tuesday’s U.S. market session to trade at $0.587. With this uptick, the ADA price prolongs its short-term recovery within the formation of a rising channel pattern. The recent on-chain activity further supports the bullish momentum as crypto whales are actively accumulating this asset. Is a breakout from the $0.6 breakout imminent?
Whale Buying Set Cardano for Major Breakout
Over the last two weeks, the Cardano price has exhibited a bullish bounce, rising from $0.5 to the current trading price of $0.5873, representing a 15% surge. Amid this recovery, the coin price showed a temporary pullback to $0.53, which validated the price as the asset bounced immediately to $0.06 on July 2nd.
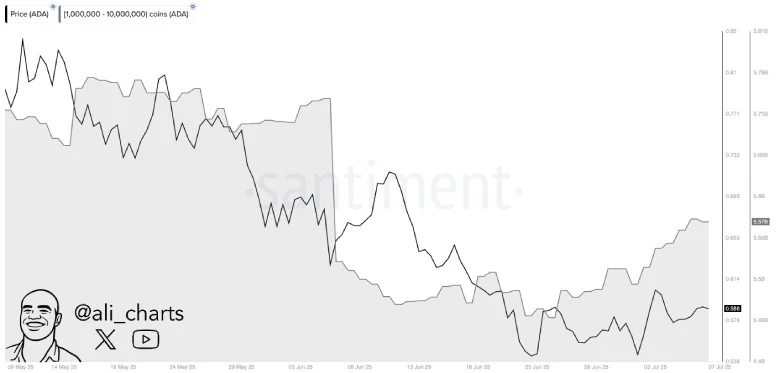
The recent on-chain data highlights that the buying pressure is not only from retail buyers but also from high-net-worth investors. Market analyst Ali Martinez tweeted data from Santiment analytics, showing that the crypto whales have bought over 120 million Cardano in the last two weeks.
While the broader market has yet to signal a continuation of the uptrend, Cardano has seen strategic accumulation by deep-pocket investors, which often precedes medium- to long-term price recoveries. This aligns with several long-term projections outlined in our Cardano forecast guide, offering a broader view of ADA’s future potential.
Channel Drive Drive Steady Recovery in ADA
A deeper analysis of the daily Cardano chart shows the price recovery resonated strictly within two ascending trendlines, indicating the formation of a rising channel pattern. The previous pattern offers both dynamic support and resistance, driving a sustained recovery trend in the price.
Following a recent bearish reversal from the pattern’s resistance trendline, the asset is poised for a 2.53% drop to retest the bottom trendline at $0.565.
If the support holds, the price build will bounce with reaccumulated bullish momentum and reach the long-running resistance trend line at $0.06. Since March 2025, the fallen trend line has acted as a dynamic support and signal for ongoing correction.
If the support holds, the ADA price could bounce with recuperated bullish momentum and challenge the long-awaited resistance trendline at $0.6.

Since March 2025, the falling trendline has acted as a dynamic resistance and signaled the continuous demand for statistics, the potential for virtual signals, a change in market direction, and bolstered the initial surge to $0.73
On the contrary, if the contrast breaks below the bottom trendline, the color code contains a grip over this asset for a continued correction.
Also Read: US Treasury Sanctions North Korean Crypto Hacking Ring
