
- Cardano price drives its current correction trend, resonating within two downsloping trendlines of a flag pattern.
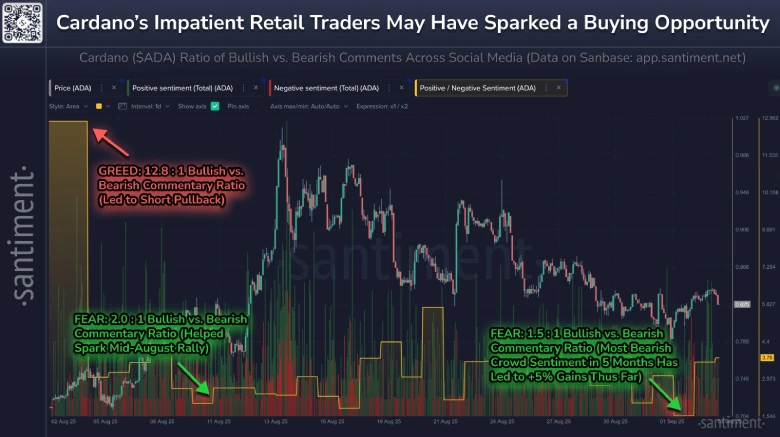
- On-chain data shows social media sentiment at a 5-month low, with only 1.5 bullish comments per bearish outlook.
- The 20- and 100-day exponential moving averages drive a short consolidation trend in ADA price.
ADA, the native cryptocurrency of the Cardano ecosystem, jumped 3.7% during Friday’s U.S. market session to trade at $0.84. The buying pressure came as a relief rally amid the broader crypto market as Bitcoin attempts to reclaim the $72,000 mark. However, the bullish momentum in ADA coin coincides with a subtle yet notable shift in market sentiment. The mounting bearish sentiment has historically triggered a notable recovery as key stakeholders step in to accumulate at a discounted price. Will the Cardano price push for a $1 rally?
ADA Recovery Set Up by Retail Pessimism and Key Holder Accumulation
The Cardano price correction takes a brief halt at the $0.8 psychological level, resulting in sideways action of short-bodied candles. The momentum indicator RSI (Relative Strength Index) at 50% accentuates the neutral sentiment in the market.
Amid the consolidation, the ADA price teases a bullish breakout from the $0.844 resistance as a sentiment shift in retail investors triggered recovery potential.
According to a recent tweet from analytics tool Santiment, the Cardano price pulled back from $0.78 as it plunged the crowd sentiment to a 5-month low. On-chain data reveals that social media platforms are experiencing a significant imbalance, with only 1.5 bullish comments for every bearish outlook.
Even though the bullish sentiment has loosened, the price rose by a good 5% last Tuesday and was able to hold support above the $0.80 mark. Analysts also say that when retail investors sell out of frustration amid an extended bear market, it often presents opportunities for larger stakeholders to step in and send the price up.
This latest three-week pullback seems to have shaken the resolve of the short-term holders, as many of them have stuck in there. While small traders sell off their bags, the key stakeholders rush to accumulate them at discounted prices. Such accumulation phases often align with broader price cycles detailed in our Cardano price prediction.
Historically, Cardano’s price action has tended to move opposite to retail sentiment. This inverse relationship suggests that the current bout of retail pessimism could pave the way for further upside.
Cardano Price Needs This Breakout to Exit Correction Trend
The daily chart analysis of Cardano’s price shows the current correction trend resonating within the formation of a bull flag. The chart setup is characterized by a long ascending pole denoting the dominant trendline in price, followed by a temporary pullback with two downsloping trendlines.
The pattern is commonly spotted within an established uptrend and allows buyers to recoup the exhausted bullish momentum.
Since mid-August, the two trendlines have acted as dynamic resistance and support for ADA’s price. With today’s intraday gain of 4.16%, the coin price teases a bullish breakout from horizontal resistance at $0.844. A potential breakout will continue the bull cycle within the flag pattern.
The Cardano price holding above the 100- and 200-day EMA slopes hints at the general bullish sentiment in the market, increasing the potential for an upside breakout.

The post-breakout rally could push the price 3.5% up and challenge the flag resistance at $0.88. This dynamic resistance is crucial for buyers to regain their momentum and reach the $1 mark.
On the contrary, the ongoing correction could be prolonged if sellers continue to defend the overhead trendline.
Also Read: Nansen AI Agent Denies Justin Sun’s Role in WLFI Price Crash

