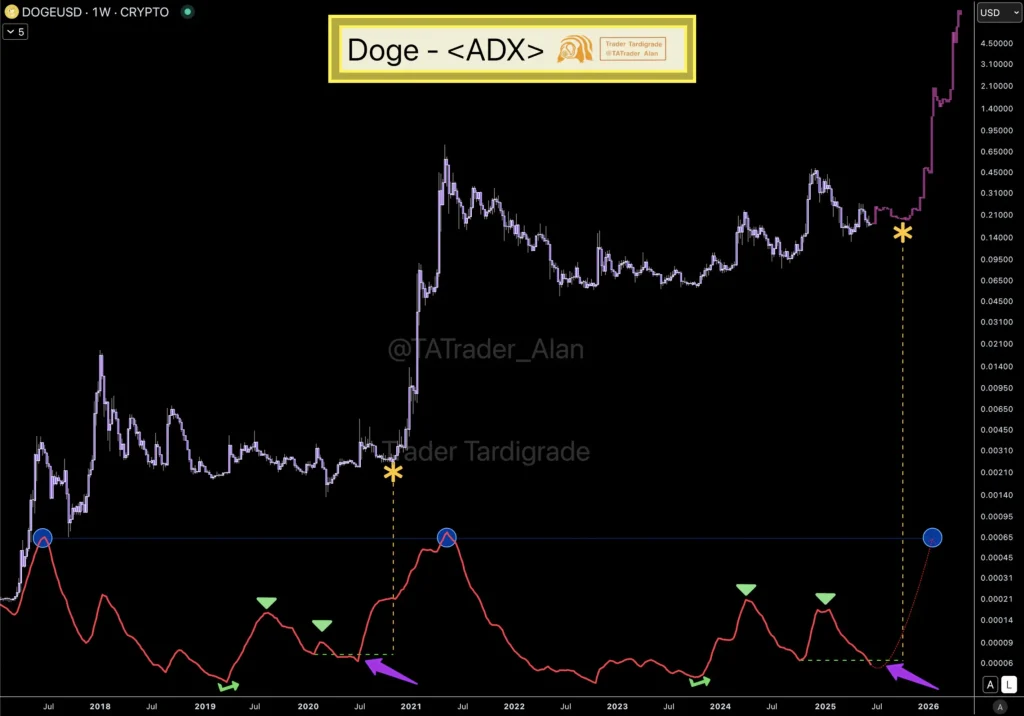
Crypto analyst Trader Tardigrade projects a potential breakout for Dogecoin (DOGE), based on signals from the token’s weekly Average Directional Index (ADX). According to the analyst’s recent chart and commentary, DOGE’s ADX has formed a “lower low” pattern, following two previous peaks in the mid-range.
This setup mirrors conditions observed in mid-2020, just before Dogecoin’s explosive rally. In the chart shared, the ADX indicator (shown in red) dropped to a lower level after peaking twice, similar to its behaviour before the major uptrend that began in late 2020.

DOGE Price Chart (Source: X Post)
The analyst highlights this with purple arrows and green triangle markers, linking the historical pattern to a similar signal forming now. A yellow asterisk on the price chart further emphasizes where past ADX behaviour aligned with a strong upward price move. Another yellow marker in 2025 suggests a potential upcoming repetition.
According to the latest DOGE price prediction insights, current technical patterns are echoing Dogecoin’s historic rally from under $0.01 to over $0.65. Back then, a similar ADX formation—marked by two peaks followed by a lower low—preceded the explosive move. Now in 2025, a third ADX peak is beginning to form and curve upward, hinting at another potential breakout. Trader Tardigrade believes this technical setup indicates strengthening directional momentum, which could lead to a significant price surge if historical trends repeat.
DOGE Orderbook Shows Renewed Buy Pressure
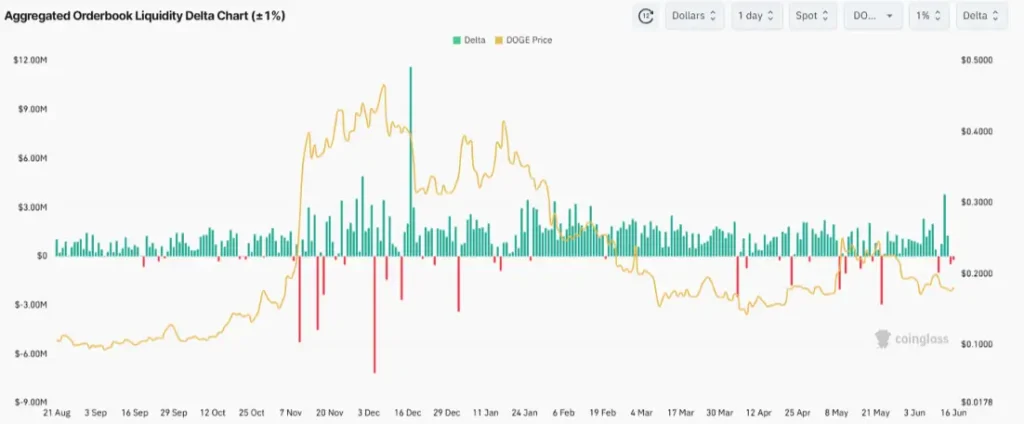
High on-chain data vindicates the technical sentiment, adding weight to Dogecoin’s bullish uptrend. Coinglass’s aggregated order book liquidity Delta Chart (1-1%) shows a significant change in order book mechanics.
The chart depicts a steady increase in the buy-side liquidity (green bars) between April and the middle of June, and more so when the price of DOGE stabilized within the range of $0.20. These liquidity deltas are net positive buy pressure at about 1% of the market price, which is a sign of intense interest in accumulation at the given levels.
DOGE Orderbook Liquidity (Source: CoinGlass)
Further acute (downward) deltas (in red) were observed at the initial stages of the chart, namely in late November and December, when the price of DOGE reached its peak of about $0.47 and then went down steadily. However, the recent reoccurrence of huge green deltas in June is a testament to renewed demand, and it could also be an indicator of the technical ADX indicator that Trader Tardigrade was indicating.
As the buy-side depth gains momentum and price consolidates, the order book figures show that the whales, or institutional participants, might be moving towards an upside break. These liquidity inflows around local lows have in the past been associated with powerful moves, particularly when accompanied by technical indicators such as the ADX dropping to a lower low.


