Bitcoin (BTC) just leaped over $106K like it’s warming up for a sprint — but not everyone’s rushing to the finish line. While short-term traders cheer, veteran holders (the “HODL army”) are quietly watching the charts, weighing their moment to cash in. The big question? Is this the breakout, or just another head fake?
With trading volume up nearly 9% and market cap climbing above $2.1 trillion, BTC’s recent price action looks bullish. Still, long-term holders — often the smart money —aren’t celebrating yet. Their hesitation signals that the rally might still be in its early innings. So while excitement brews on the surface, a deeper tension is building: Will the rocket launch… or stall?
3–5 Year BTC Holders Ease Up on Distribution
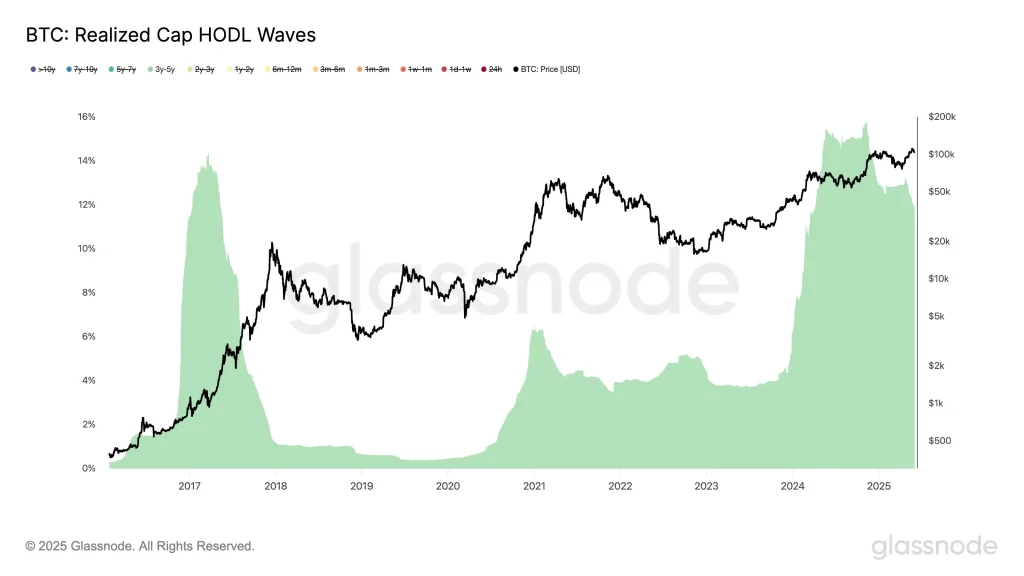
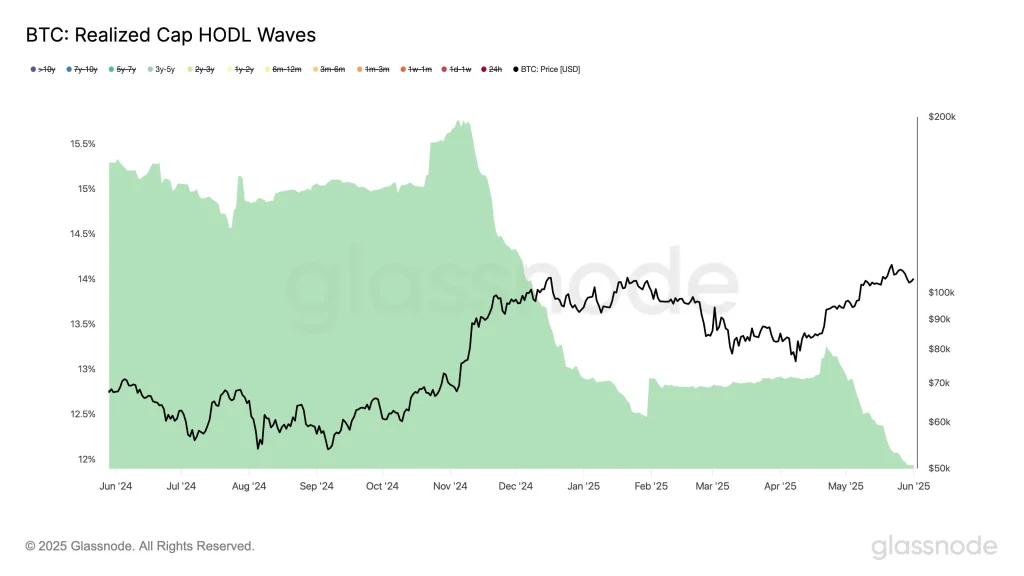
Following the April 2025 reacceleration in selling from the 3–5 year cohort, the HODL Waves data now shows a pronounced decline in their share of supply, falling from the November 2024 peak of 15.7% to 11.9%. This drop is meaningful: although distribution has resumed, the cohort’s supply share remains significantly elevated compared to previous cycle bottoms (3%), reinforcing the notion of a lingering sell-side overhang.

BTC Realized Cap HODL Waves (Source: X Post)
The sharp reduction in May–June 2025 aligns closely with Bitcoin’s climb toward and above the $106K level. This hints that this age band is actively offloading into market strength — a typical behavior pattern for long-term holders seeking optimal exit liquidity.
Despite this, the pace of distribution appears to be slowing, suggesting exhaustion or a wait-and-see sentiment among remaining holders. This cohort likely anticipates even higher prices, delaying further exits until the cryptocurrency exhibits stronger momentum or reaches a psychological milestone, e.g., $120K+.
BTC Realized Cap HODL Waves (Source: X Post)
Zooming out, historical trends show that elevated HODL Wave levels precede major price peaks but don’t always coincide exactly. The gradual tapering in current wave thickness may mark the start of a topping phase or simply a cooldown before a second leg higher.
BTC Patterns Point to Parabolic Move in 2025
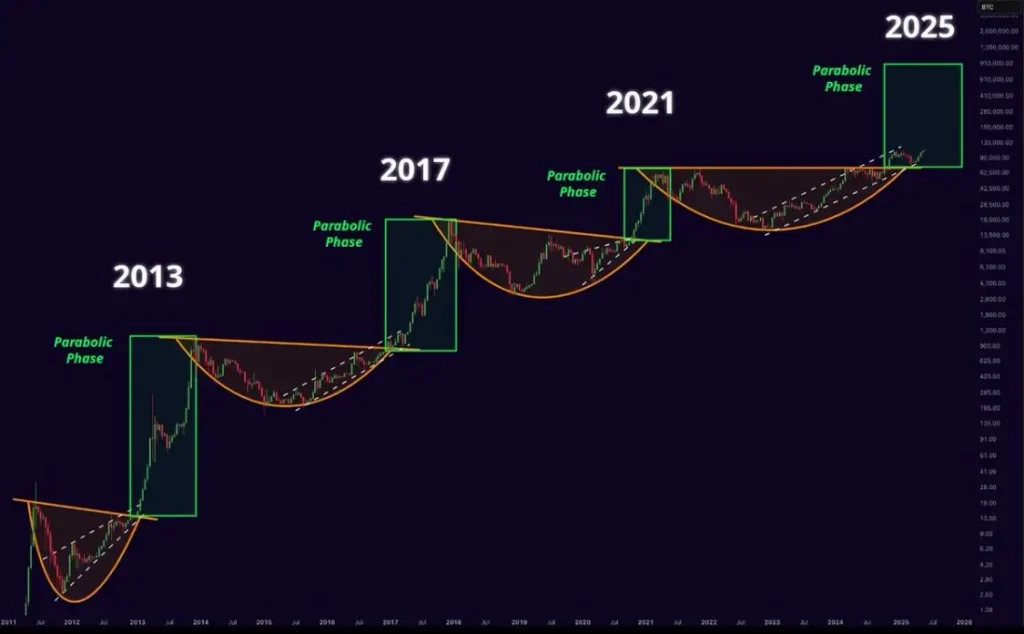
The broader change in behavior is very much in line with the technical pattern spotted by The ₿itcoin Therapist. His Bitcoin chart illustrates a recurring cycle: after every consolidation arc comes a parabolic phase — a vertical eruption in price driven by explosive demand and speculation. This has occurred three times in the past, in 2013, 2017, and 2021, and now experts believe the next repeat will happen in 2025.
BTC Token Price Chart (Source: X Post)
With the cryptocurrency’s curve ascending once more and giving a similar rounded shape, history suggests a new climb in its path. Each previous breakout occurred shortly after this arc completed, pushing the BTC token to fresh all-time highs and into what analysts often call the “euphoria zone.”
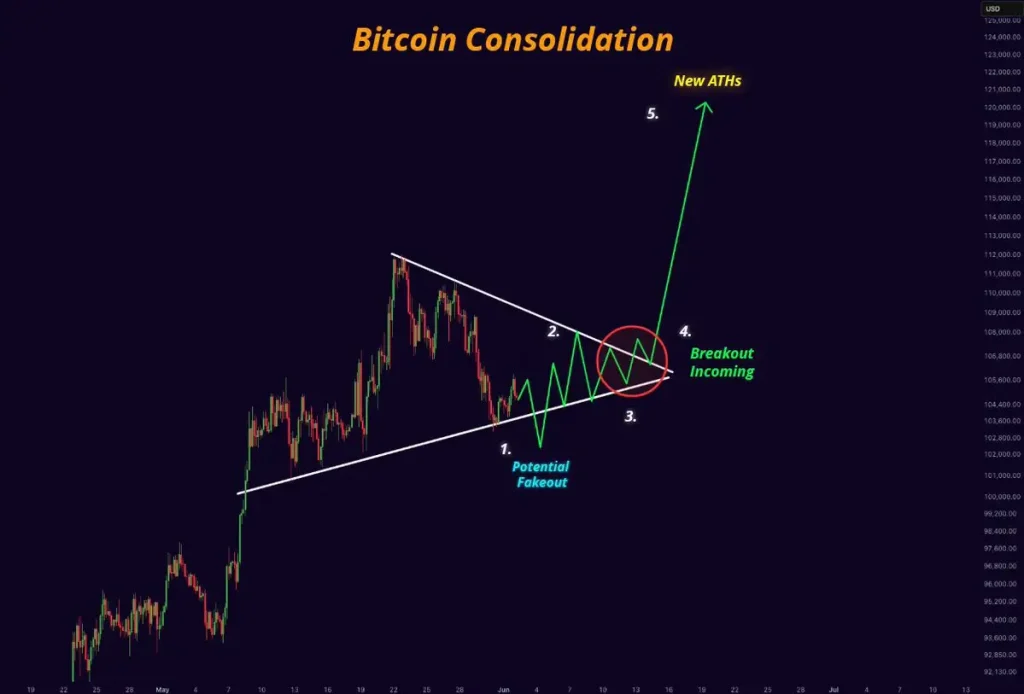
Along with the long-term prognosis, another analyst, Sensei, thinks that Bitcoin could see a near-term breakout from its recent consolidation. Following a symmetrical triangle, Sensei describes five price action stages, noting that the breakout might take place in mid-June. Such a move aligns with this detailed Bitcoin price prediction, which outlines potential highs of $120K to $200K.
BTC Token Price Chart (Source: X Post)
Such a move might take Bitcoin to $120,000 in the short term and could see it hit a new all-time high of $200,000 in the future. The analyst makes a visual argument that the Bitcoin cryptocurrency is now in a period of consolidation and is expected to make a sharp change quickly, copying patterns seen in previous rallies.
Also Read: Ethereum On-Chain Metrics Signal Weak Sell Zones— Is $3,000 Breakout Imminent?


