Bitcoin (BTC/USDT) is showing signs of a potential bullish breakout, as current price action mirrors a previous liquidity-driven reversal. The asset is trading around $107K with a 1.72% gain on the day, while technical indicators suggest a short-term dip could precede a strong upward rally.
BTC Chart Repeats Bullish Pattern, Eyes $108K to $111K
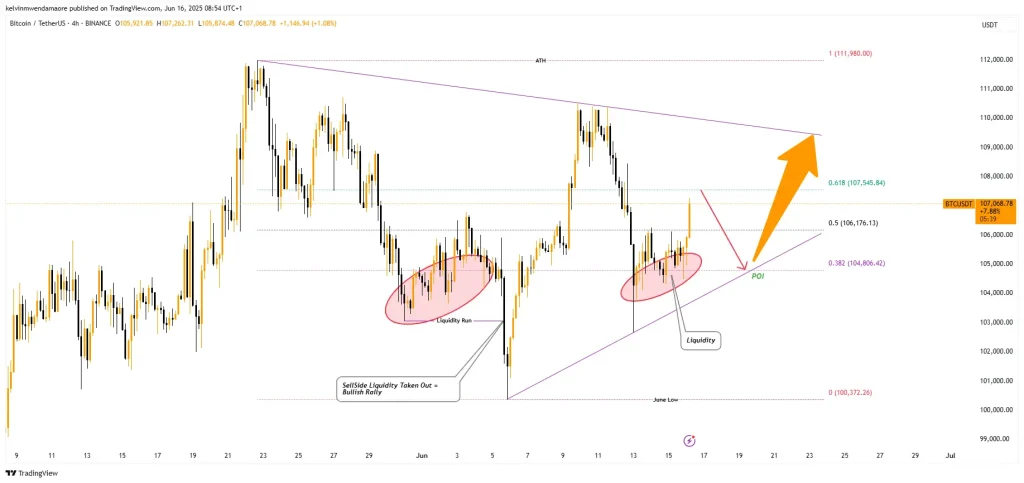
The 4-hour chart reveals a repeating structure where the BTC token previously experienced a sell-side liquidity sweep in early June, marked by a breakdown below a local low before swiftly reversing into a bullish rally. A similar formation is now evident, with the price consolidating near key liquidity zones just around the $104,800 mark, aligned with the 0.382 Fibonacci retracement level, as highlighted in this Bitcoin price prediction.

BTC Price Chart (Source: TradingView)
The trendline from the recent June low intersects with the projected point of interest (POI) near $104K, forming a technical confluence. Should price retrace into this region and hold support, it could ignite a move toward $107,500—the 0.618 Fibonacci level—and possibly higher toward $111,980, the 1.0 Fibonacci extension.
This setup suggests that Bitcoin may intentionally dip to sweep residual liquidity before resuming its upward trajectory, retesting the upper descending resistance line. The overall price structure supports a bullish continuation if the POI acts as a springboard, reflecting recurring behaviour seen earlier this month.
Liquidation Map Shows $104K as Key Reversal Zone for BTC
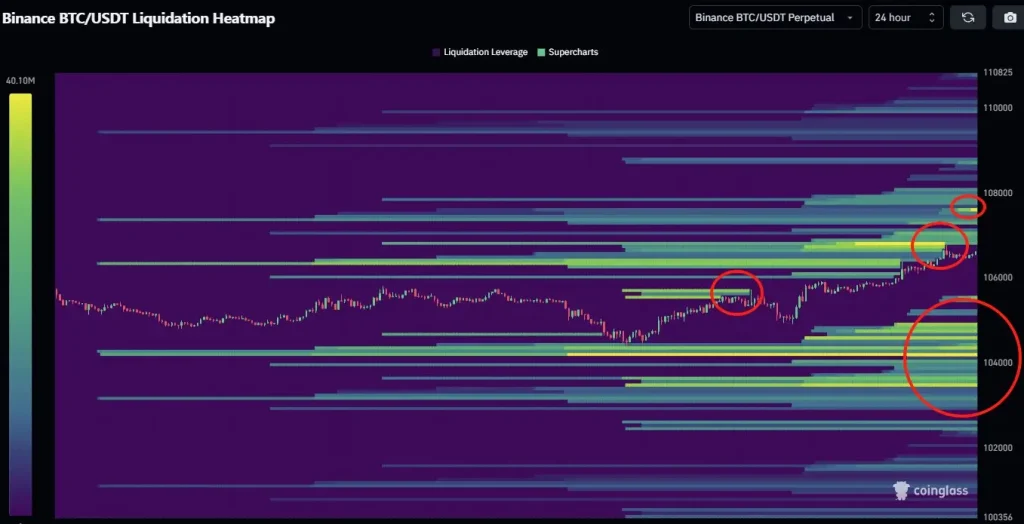
Recent liquidation heatmap data from CoinGlass supports the BTC/USDT price action analysis and reveals significant leverage concentration around the $104,000 level. All these are evident in the Binance BTC/USDT liquidation heatmap, which indicates evident bands of dense leverage exposure below the present market level, especially between $103,800 and $104,200.
BTC Liquidation Heatmap (Source: X post)
This correlates with the point of interest (POI) discovered on the BTC chart, where it is highly likely that Bitcoin will fall and sweep liquidity within that range. This would precipitate the liquidation of the long positions and reset the momentum towards a breakout. The same was seen earlier at around the $106K mark, which was followed by an aggressive move.
Another liquidity zone (on the upside) at approximately $108,000 is also within the price action radar. According to the CoinGlass chart, the BTC cryptocurrency might initiate a resolute move towards 108K, where trapped shorts exist and high liquidation levels will be attained.
In short, the current price of about 107K, as the future shows, suggests a liquidity grab at 104K and then continued strategies, which is normal in connection with smart money algorithms in recent history.
Also Read: Metaplanet To Issue $210 Million Zero-Coupon Plain Bonds to Increase Bitcoin Holdings


