- Brett coin price shows early recovery signs amidst a broader market uptick.
- The liquidity provided by the Coinbase DEX integration enhances the potential surge of Brett.
- Accumulation indicators are indicative of a short-term opportunity, but the trend must be confirmed
Brett (Based) BRETT, an Ethereum Layer 2 meme coin, is attracting attention in the crypto space as it rises by 2.47% in the past 24 hours. This surge comes amid a broader crypto market uptick, with BTC price hovering above $110k. Although it has faced a recent downward trend due to a market consolidation, Brett crypto has already shown some signs of recovery and may experience a potential explosion, with some even speculating that it could shoot to $0.10.
Brett Price Surge Amidst Crypto Market Growth
Coinbase recently integrated its app with decentralized exchanges (DEXs), enabling users to trade Base-native tokens like BRETT directly using their Coinbase balances. This action makes access to millions of users, especially in the United States, easier and may result in increased liquidity for Brett coin.
And being among the highest-ranked meme coins in the Base ecosystem, with a market cap of $459 million, Brett is now poised to be a direct beneficiary of the augmented activity of DEXs. Indeed, the integration was accompanied by a 3.7% increase in the market cap of Base ecosystem tokens, indicating trading interest.
Brett token hit an all-time high of $0.2342 and an all-time low of $0.0008475. It is currently being traded 80.17% below its peak, though it is still 5,378.71% above its lowest point. Such a large price movement has attracted the attention of Brett, who is currently exhibiting signs of accumulation, implying the possibility of a price action shortly.
Brett Price Shows Signs Of Accumulation
Brett coin price is already starting to accumulate after several months, and the mid-timeframe chart shows that the market sentiment has changed. The trend we are witnessing is not an indication that the company is going to transition to a 40 billion market value, but it does offer a short-range trading opportunity.
For the first time in months, $BRETT is showing mid-timeframe signs of accumulation 👀
Congrats bread haulers no, we’re not going to $40B mcap, but there might be a scalp opportunity lining up.
Not yet needs more time displacement. But it’s officially back on my watch list.… https://t.co/HA9yqB4x7h pic.twitter.com/LuSFo9sgNI
— Wyckoff Insider (@Wyckoff_Insider) September 2, 2025
The situation is now more conducive to those seeking fast, mini gains on price swings, which is otherwise referred to as scalp trading. But it is important to mention that such a shift will require more time to attain full development since the asset will need more time to be displaced to ensure that it is sustainable.
There is still more price action needed to confirm the accumulation phase of the asset. The move is set with a fresh supply region, which is clearly indicated on the chart, as the price range to monitor any upward trends over the next few days.
Is Brett Price Heading to $0.10?
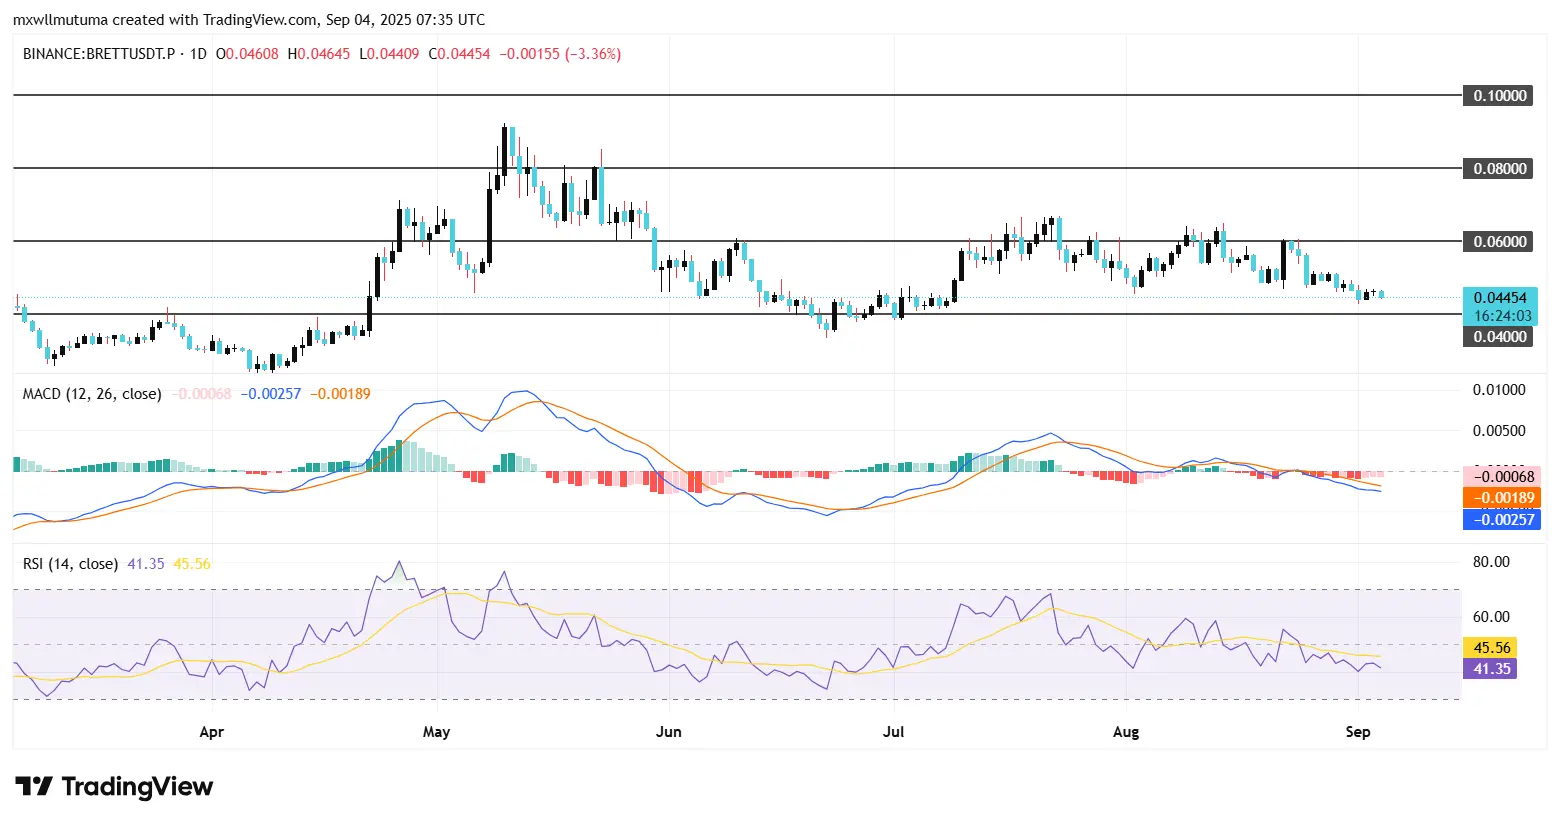
Brett price has been facing significant volatility in the past few months, with notable fluctuations. As of September 4, 2025, the coin was trading at $0.04425, which represents a 2% surge for the day.
This follows a stable price trend that experienced its highest value of $0.04645 and tumbled as low as $0.04414 over the past 24 hours.
The chart also shows a relatively neutral MACD (Moving Average Convergence Divergence), and the histogram has a weak bearish flavor.
The MACD line now lies below the signal line, which can be taken as a continuation of the bearish trend, provided that the selling pressure continues. But the MACD continues to indicate weaker negative momentum, so the BRETT price may be moving to consolidation first, too.
The Relative Strength Index (RSI) stands at 41.03, showing that the market is nearing to reach the oversold region but is yet to reach where the market is generally expected to revolve.

The Brett coin price chart indicates a marked resistance at the price of $0.06, and earlier price movements reveal multiple efforts to get beyond this point. Another resistance is noticed at about $0.08, and the peak of the current price cycle is noticed at $0.10.
On the negative side, the recent price movements have created support levels at $0.044. Should the price keep on decreasing below this support level, the next significant support may be at about $0.040.


