A familiar rhythm is echoing through Bitcoin’s price chart—one that hints at a powerful surge just over the horizon. After a series of corrective dips, measured bounces, and consolidation periods, it seems that the top cryptocurrency is gearing up to perform another parabolic rally.
Bitcoin’s Rhythm Repeats: $175K in Sight After CME Gap?
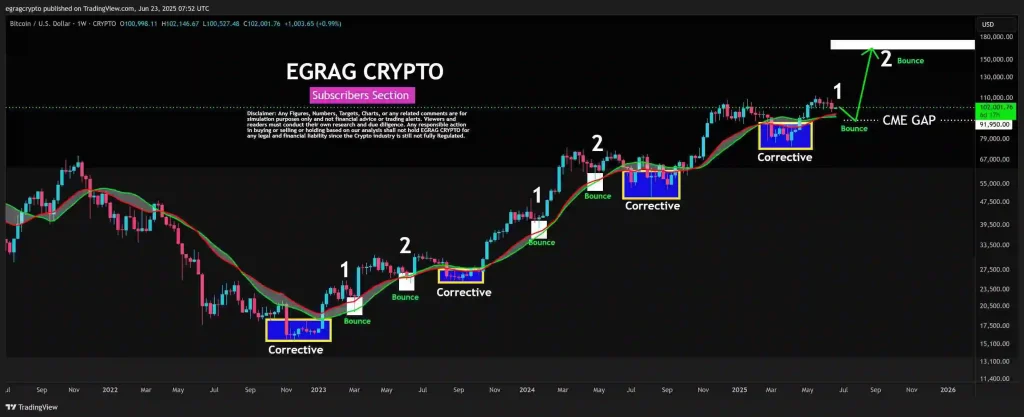
According to crypto market analyst EGRAG CRYPTO, this setup is not coincidental but part of a well-defined and historically reliable pattern. He identifies a five-step cycle—beginning with a corrective move below the Bull Market Support Band (BMSB), followed by two distinct bounce phases, and culminating in another correction—that has repeated multiple times since 2023.
Per EGRAG, Bitcoin is presently making a move to the first big bounce of this cycle. This sets it on a solid bullish direction that has the potential to eventually propel the price of the token to the level of the $175,000 threshold.

Bitcoin Price Chart (Source: X Post)
As the BTC cryptocurrency hovers around the 100,000 mark, EGRAG points to a CME futures gap at $91 950 that has not been reached yet, potentially as a retesting point before the next considerable rise occurs. Once that gap is filled, the analyst anticipates a decisive move toward $140K—$160K, followed by a smaller bounce to finalize the climb around the $175K mark.
Short Squeeze Setup: BTC Eyes ATH as $100K Liquidity Gets Swept
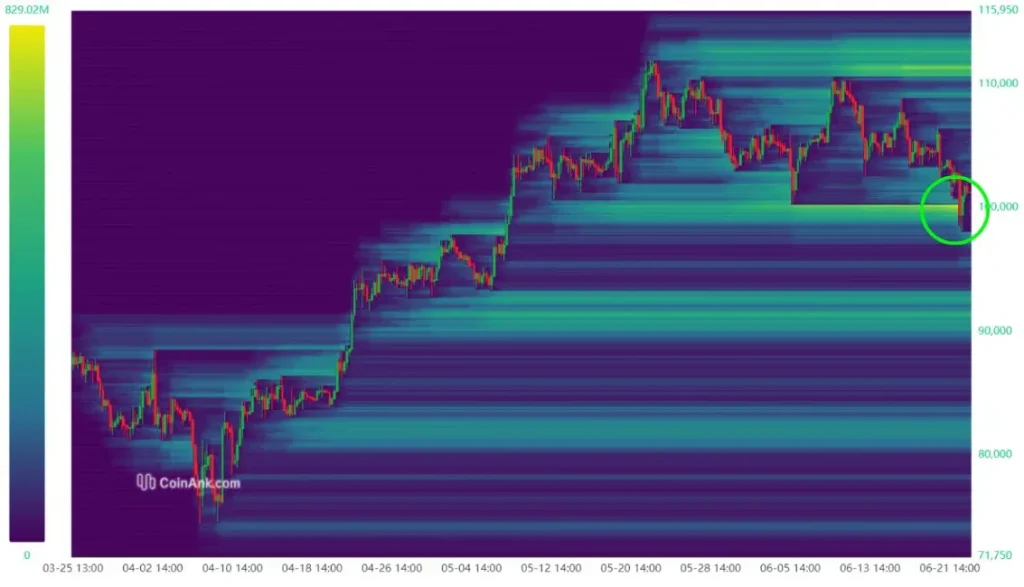
Adding to the growing consensus of BTC projections, market analyst Gert van Lagen points to a fresh liquidity event that may act as a launchpad for Bitcoin’s next leg up. Touching on his breakdown, van Lagen observed that the BTC token has recently swept a liquidity pool located around the $100,000 mark, an adequate clearance of a group of stop-losses and long positions.
Bitcoin Liquidity Heatmap (Source: X Post)
Having gotten rid of this level, he singles out the all-time high (ATH) zone as the next area of focus, declaring it an excellent magnet for price, which means there is a possibility of a short squeeze around the corner.
The main short liquidation cluster now sits right at the ATH zone — a strong magnet for price. Short squeeze incoming?
This transformation can be observed graphically in the adjacent heatmap graphic as a dense zone of liquidity shifts upwards to the high end of the pricing range. This typically causes price explosions due to the rush to cover by short sellers, and the snowball effect works in keeping the price momentum moving higher.


