


On Wednesday, July 9th, the Bitcoin price experienced heightened volatility, as indicated by the short-bodied, high-wick daily candle. The uncertainty can be attributed to the recently announced tariffs by the United States on six other countries. While the lack of bullish momentum may discourage retail traders, crypto whales continue to accumulate BTC, signaling a potential for a bullish breakout.
Distribution from Small Wallets Meets Aggressive Whale Accumulation
Since last weekend, the Bitcoin price has been struggling to surpass $110,000 resistance, which has led to a short-term consolidation phase. While a sideways action close to the all-time high of $112,000 may create concern for retail traders, the high-net-worth investors continue to accumulate more BTC.
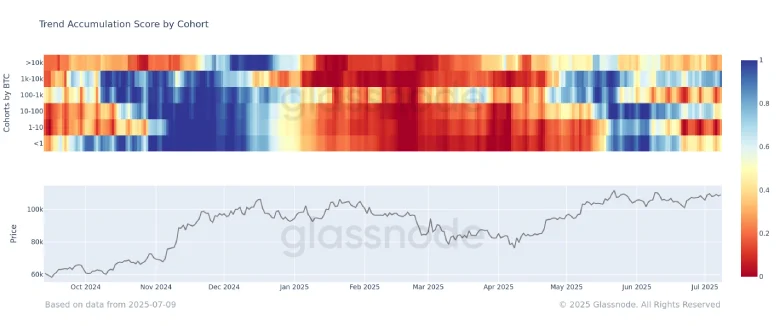
According to blockchain analytics platform Glassnode, most wallet cohorts holding between 1 to 10 BTC are currently in a distribution phase, suggesting uncertainty or profit-taking from small holders. On the contrary, those holding between 1,000 to 10,000 BTC show a “near perfect accumulation” phase signaling high confidence in Bitcoin’s long-term growth.
This divergence highlights retail caution versus institutional conviction, pointing to a supply shift in the Bitcoin market.
Historically, such a split in conviction has short-term uncertainty but often precedes a stronger and more sustained recovery in the long run.
Bitcoin Eyes $112k Surge Amid Pennant Pattern Breakout
The 4-hour analysis of Bitcoin price shows the current consolidation as the formation of a bullish pennant pattern. Typically, this chart setup displays a long ascending trendline, denoting the dominant uptrend, followed by a short correction for buyers to recuperate the bullish momentum.
With an intraday surge of 0.3%, the coin price attempts a bullish breakout from the pattern’s resistant trendline. If successful with the 4-hour candle closing above the resistance trend, the price surpasses the immediate resistance of $110,000, followed by a breakout challenge to the ATH resistance of $112,000
The sharp incline in daily exponential moving averages (20, 50, 100, and 200) indicates a general bullish sentiment in the market, reinforcing the breakout potential.

On the contrary, if the broader market uncertainty persists, sellers could force a breakdown below the patent support trend and add $100,000 and $108,000 lows.
