- Bitcoin price rides a mid-term uptrend amid the formation of a rising channel pattern.
- The shrunken volatility in BTC has historically set the stage for sharp price movements.
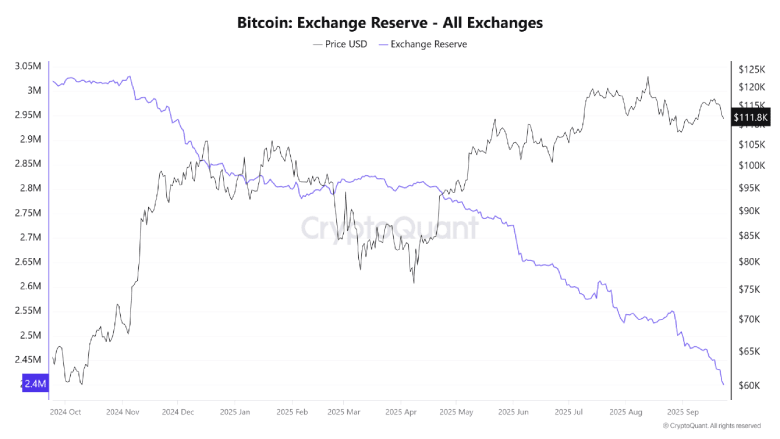
- A steady decline in BTC held on exchanges indicates strong conviction from buyers.
On Wednesday, September 24th, the Bitcoin price witnessed a slowdown in its correction trend and bounced 1.65%. The upswing likely came as a relief rally after a significant pullback since last week, potential recouping the exhausted bearish momentum. While the risk of continued correction persists, the latest on-chain and derivative data hints at a calm, yet underlying bullish strength in the market.
BTC Exchange Balances Shrink as Market Awaits Clear Direction
Bitcoin price is experiencing one of its quietest phases in recent memory, with implied volatility dropping to levels last seen in 2023. At that time, low volatility preceded a sharp up move that tripled the value of the asset. The current market sentiment is once again picking up noise as multiple on-chain and derivatives metrics indicate the calm before the storm.
According to CryptoQuant data, balances on exchanges continue to decline. The amount of Bitcoin available for immediate trading or sale is now at its lowest level in several years. When exchange liquidity is limited, small increases in buying can lead to increased price volatility.
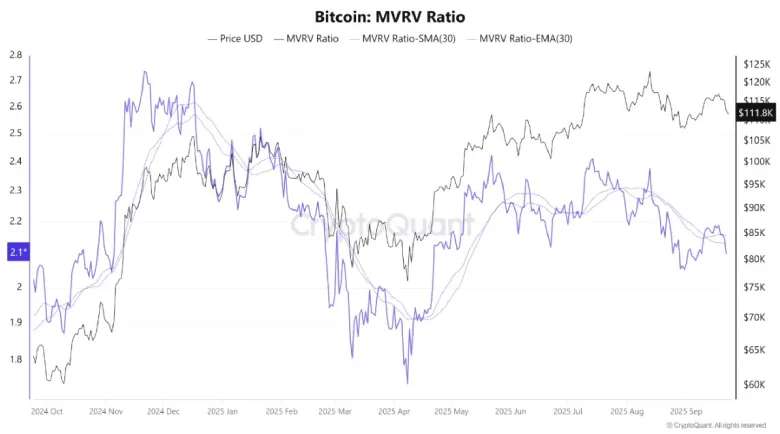
Another ratio, Market Value to Realized Value, is close to 2.1. This range of MVRV is viewed as a middle ground, where holders are neither sitting on deep losses nor unusually large gains. With little motivation to sell or take profits aggressively, market players seem to be waiting for a clearer indication.
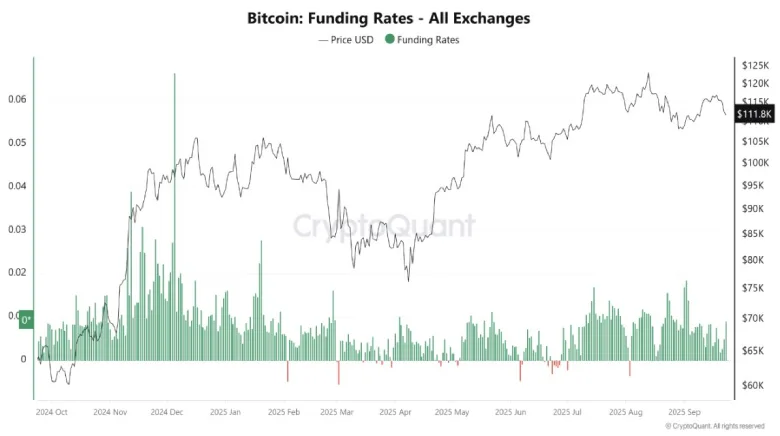
Derivatives markets are also showing restraint. Funding rates on the major exchanges are still slightly positive, but without the extremes seen in times of maximal speculation. The balance between long and short positions indicates that traders are not taking significant directional positions.
The shrinking of exchange reserves, a flat profitability environment, and quiet leverage highlight a general state of stagnation in the market. These conditions have in the past been followed by major breakouts; however, there is still uncertainty when and in what direction the breakout will occur.
Bitcoin Price is Nearing a Make-or-Break Floor
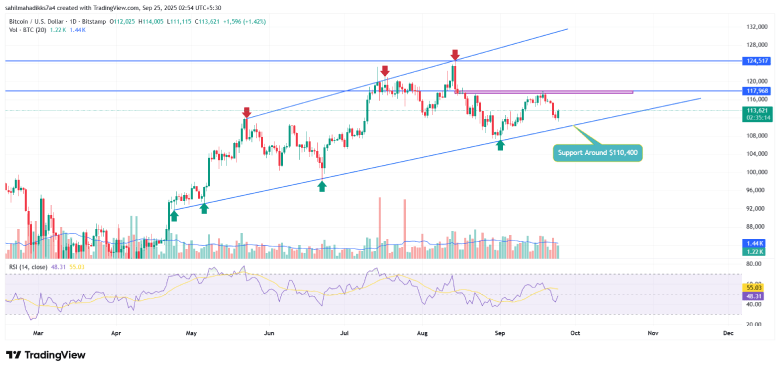
Over the past week, Bitcoin registered a pullback from $117,698 to a recent low of $111,115. This downswing created a fresh lower-high formation in BTC’s daily chart, signaling the start of an established correction trend.
However, the coin price bounced 1.42% during Wednesday’s market hours to currently trade at $113,670. This relief rally, backed by low trading volume, indicates weak conviction from buyers and a higher possibility for continued correction. With sustained selling, the BTC price may fall another 3% and retest the bottom support trendline of the rising channel pattern at $110,400.
Since late April 2025, the Bitcoin price has rallied steadily within the two rising trendlines of the channel pattern. To date, the bottom trendline of the pattern has acted as a strong accumulation zone for buyers to recoup their bullish momentum. The historical data of this pattern shows that a bullish reversal from the lower boundary has often bolstered an upswing ranging from 20% to 25%.
Thus, the potential support retest stands as a key pivot level for the Bitcoin price. If the demand pressure is intact, the buyers could drive a 6.5% jump to re-challenge the $118,000 resistance.
A bullish breakout from this resistance would position BTX to drive a rally past the $125,000 mark.

On the contrary, note a bearish breakdown below the channel support would accelerate the selling pressure and drive an extended recovery potentially to the $100K mark.
Also Read: Midas, Axelar’s Tokenized XRP Vault Hits 95% In Just 2 Days


