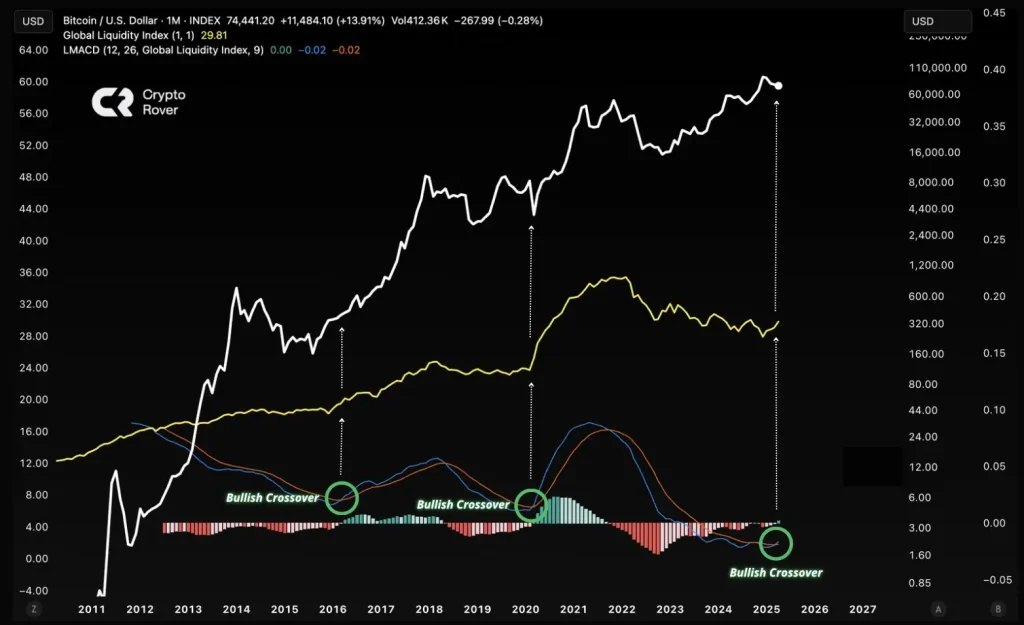
Bitcoin is once again flashing a major optimistic signal as a rare but powerful bullish crossover has been printed on its Liquidity MACD (LMACD) indicator. Historically, this event has often preceded explosive price growth.
As shown on the market analyst Crypto Rover’s chart, this crossover—where the blue trend line overtakes the orange one—has only happened twice in the past decade. Each time it led to massive bull runs, once before the 2017 surge and then again before 2021.

Bitcoin Liquidity MACD Indicator (Source: X Post)
The same setup is now back, in early 2025, and the timing couldn’t be more interesting. As the cryptocurrency recently burst out of a nine-day consolidation pattern and aimed to hit $98,000, this signal driven by liquidity could, in fact, be what it takes to get there.
The white line in the chart tracks the token’s price, while the yellow line represents global liquidity. When both rise in tandem—as they appear to be now—it’s historically been a green light for a significant rally. In short, liquidity is returning, the technicals are aligning, and the BTC cryptocurrency might be gearing up for its next big move.
Bitcoin Breaks Out of 9-Day Triangle, Analyst Targets $98K
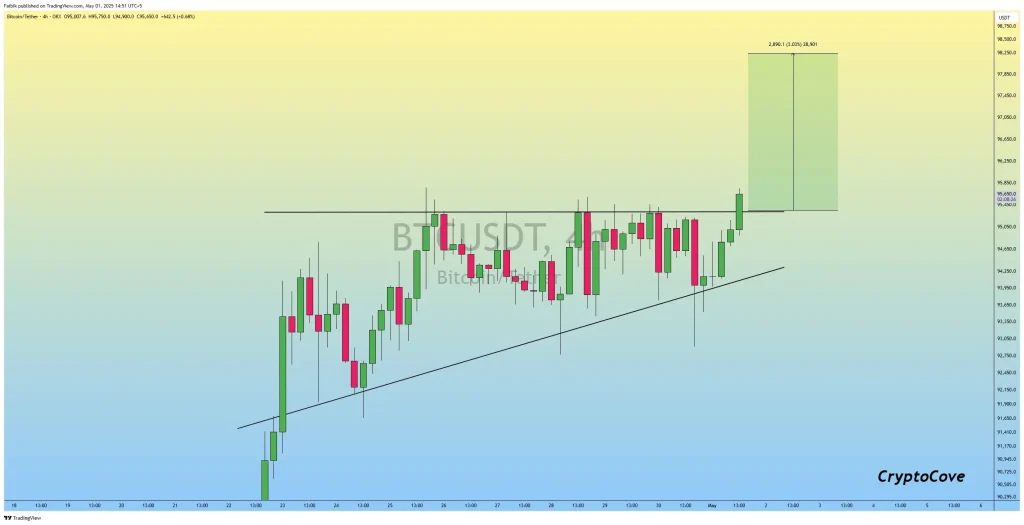
Crypto market analyst Captain Faibik has made a Bitcoin prediction, suggesting BTC might reach $98,000 after a bullish breakout of an ascending triangle pattern. According to Faibik’s analysis, BTC managed to break out after well over nine days of consolidation, during which it retested both the triangle’s upper resistance and lower support boundaries with no definitive breakout to the upside or downside.
According to the analyst’s 4-hour BTC/USDT chart, the token successfully broke through horizontal resistance around $95,660 on May 1, 2025, marking the conclusion of a prolonged period of indecision. The chart displays a clear ascending triangle formation, traditionally a bullish continuation pattern, with higher lows converging toward a static resistance line.
Bitcoin Price Chart (Source: X Post)
The breakout candle broke out of this resistance, and a target box showed the probability of approaching an upward move of approximately 3.03% from the breakout level. Ultimately, Captain Faibik interprets the breakout as a strong technical signal with a measured move in play targeting the $98,000 in the near term. Such breakouts are often considered to be key momentum signals, particularly just after an extended period of price compression, as seen here.
MVRV Momentum Hints at Further Upside Potential
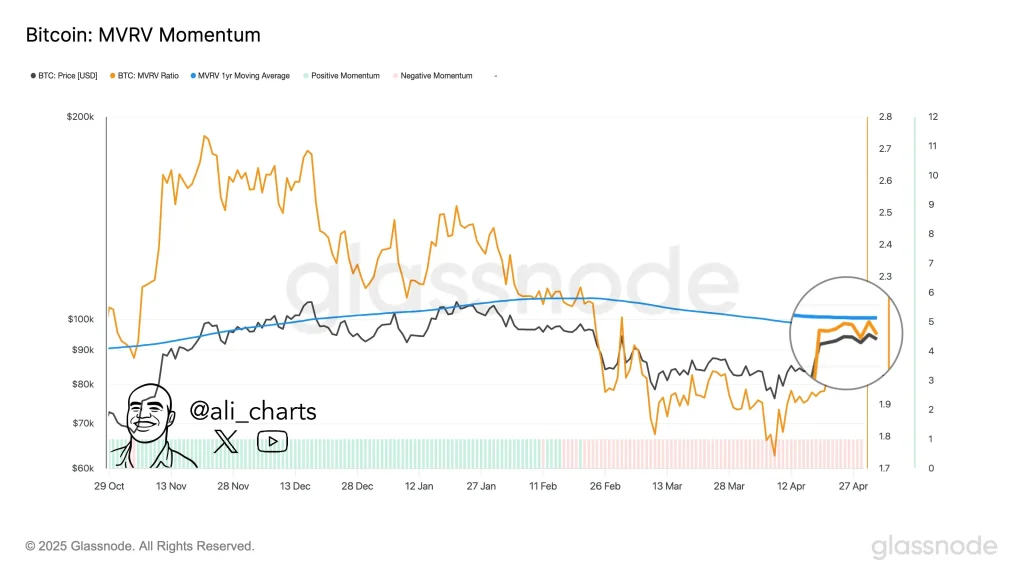
Contributing to the mounting bullishness, on-chain analyst Ali_charts observed a key sign: the possibility of Bitcoin’s MVRV (Market Value to Realized Value) ratio crossing above its 1-year Simple Moving Average (SMA). According to a chart shared via Glassnode, the cryptocurrency is hovering just below this key threshold, and any definitive crossover could serve as a “golden cross” signal—one that has historically preceded strong upside moves.
Bitcoin MVRV Momentum (Source: X Post)
The MVRV ratio, shown in orange, measures market profitability. If it goes above the blue 1-year SMA, it means that holders are growing, often intensifying bullish strength. The latest MVRV ratio data shows the indicator consolidating just below the 2.3 level, and BTC is trading between $95K and $98K.
Consequently, Ali notes that this crossover would cement the bulls’ bid for control and fuel the already prevalent narrative that the BTC token may be entering a new leg up in its larger market cycle.
Also Read: Ripple’s Chris Larsen Set to Meet SEC Chair Paul Atkins


