Bitcoin has now surpassed its all-time highs and is currently above 117K after briefly touching the 118.8K mark, which is an incredible milestone in the crypto market. Nevertheless, Glassnode analysts indicate that the rally could be the beginning. Behind the scenes, Bitcoin’s supply dynamics are flashing some of the most robust bullish signals in years.
The latest on-chain data reveals a tightening grip on supply. Long-term holders and smaller retail entities are scooping up BTC at a pace that’s outstripping new issuance. In other words, more Bitcoin is being taken off the market than added to it, creating what analysts describe as a “structural supply squeeze.”

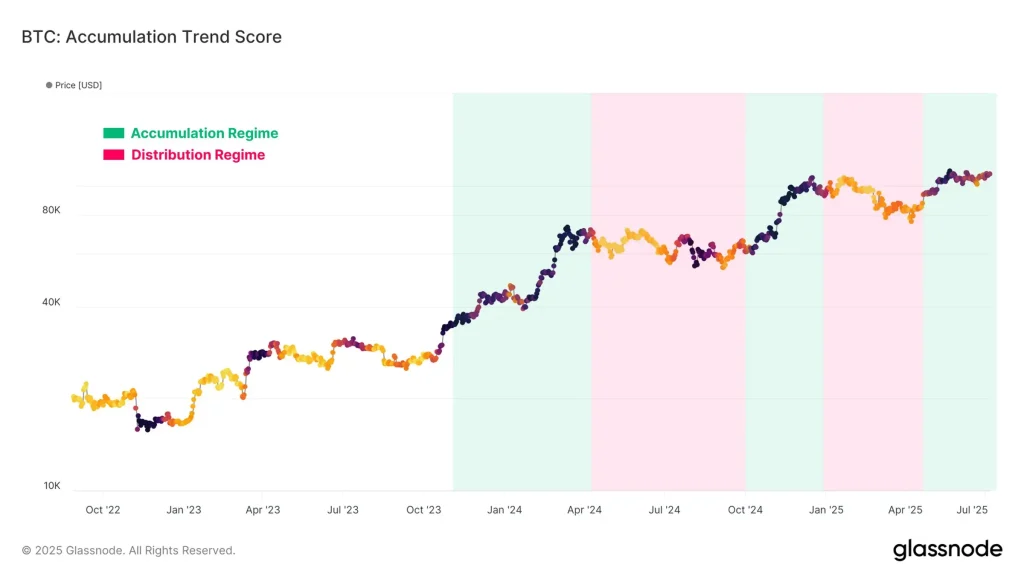
Bitcoin Accumulation Trend Score (Source: Glassnode X Post)
The trend is captured in the Accumulation Trend Score, which is currently far under in the green Accumulation Region. Historically, such areas have been the predecessors of significant price growth. The message is clear: smart money is not selling; it is stacking.
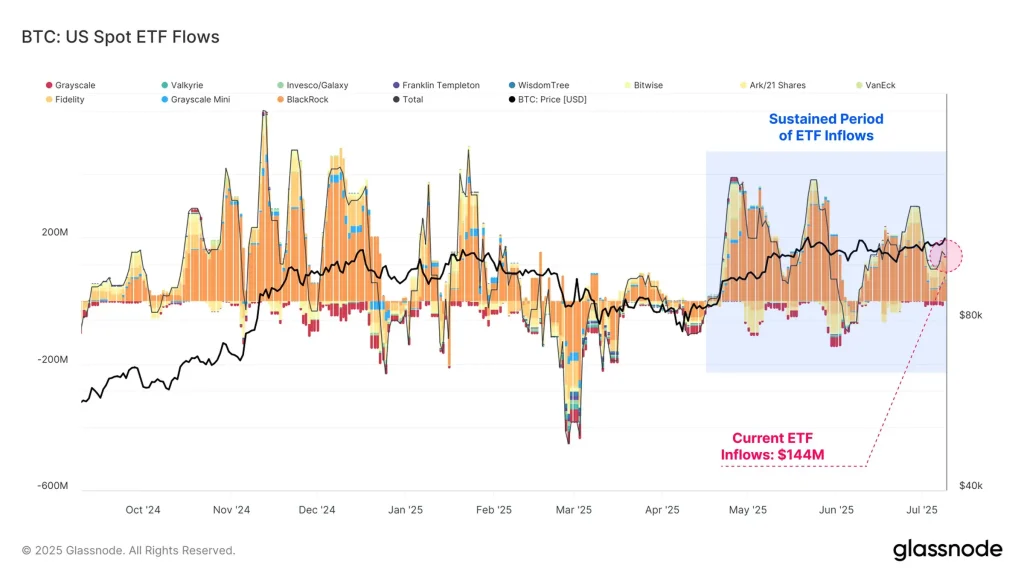
Adding fuel to the fire is the steady drumbeat of institutional demand. While ETF inflows aren’t as explosive as the early-year surge, they remain consistent and positive. The current ETF inflow regime has created a sustained demand base that is quietly supporting the rally, especially as exchange balances continue to drop and miner sell pressure dwindles.

BTC U.S. Spot ETF Flows (Source: Glassnode X Post)
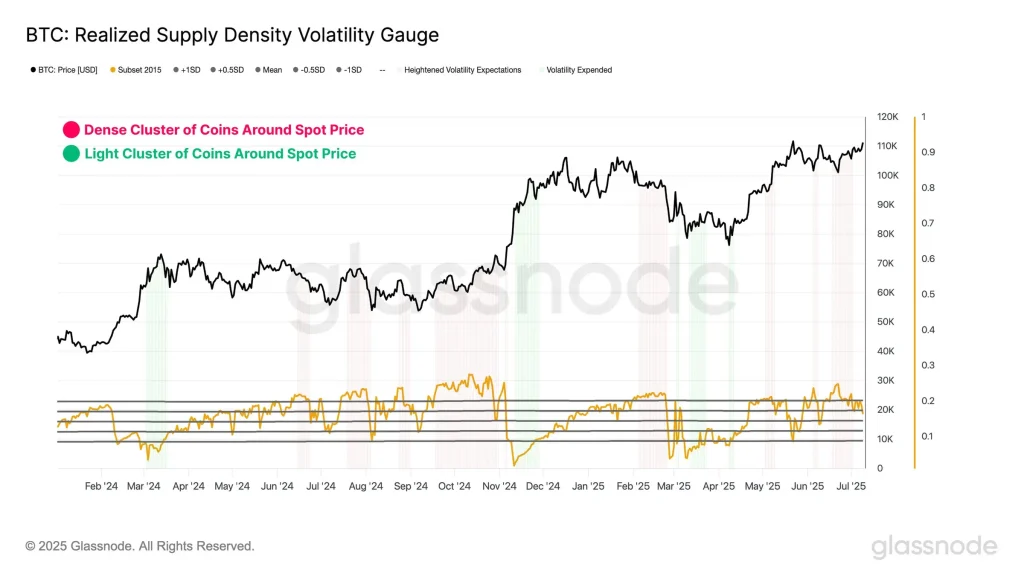
Meanwhile, volatility—a key ingredient for explosive price moves—is drying up. Glassnode’s Realized Supply Density Volatility Gauge shows BTC in a compressed state across multiple timeframes. Markets don’t stay quiet forever, and when volatility coils this tightly, a big move often follows. With the token’s price now on the move, the next leg of the rally may already be in its early stages.
What’s particularly striking is how the token has reacted during recent dips. Each time prices have pulled back, accumulation has surged. This kind of aggressive buying, especially from entities known for long-term conviction, shows that strong hands increasingly hold BTC. It’s not just a speculative spike—this is foundational support.
Bitcoin Realized Supply Density Volatility Range (Source: Glassnode X Post)
In sum, the data points to a powerful convergence: limited supply, strong institutional inflows, committed long-term holders, and compressed volatility. As the BTC token tests new price territory above its former ATH, analysts at Glassnode reckon that it may be early days yet before the breakout momentum peaks in the weeks ahead.
Bitcoin’s Historic Pattern Aims for $184K Top
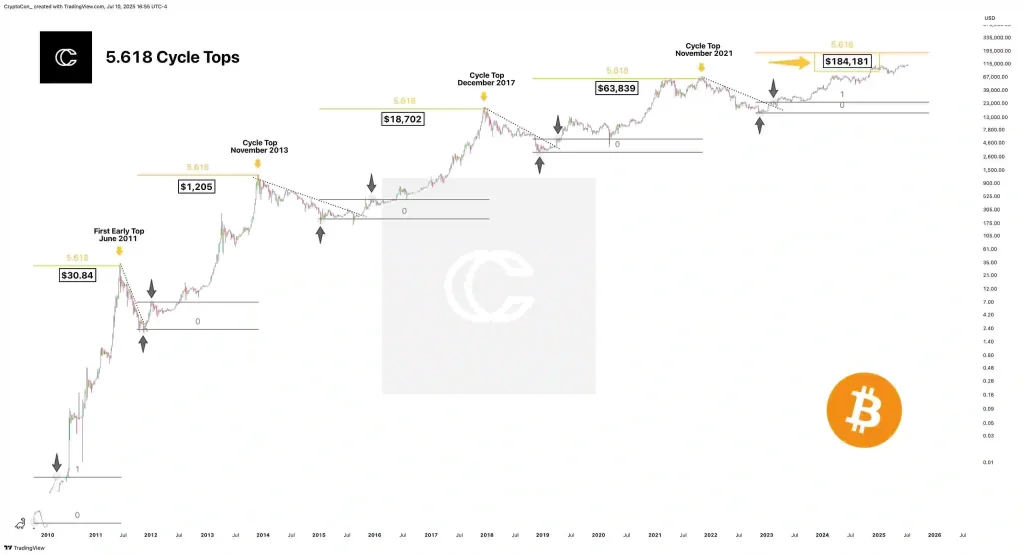
Adding another layer of insight, CryptoCon’s latest analysis suggests Bitcoin’s trajectory may once again be following its time-tested rhythm. By applying a 5.618 Fibonacci extension from the first significant move of each cycle, CryptoCon identifies a strikingly consistent pattern—one that has accurately predicted every major BTC top for over a decade.
Since 2011, when it peaked at $30, then in 2013 at $1,205, in 2017 at 18,702, and in 2021 at 63,839, every successive peak was near the 5.618 level. Now, that same model projects a potential cycle top at $184,181.
Bitcoin Price Chart (Source: X Post)
With the cryptocurrency recently pushing past $117K, the idea that another leg higher could be coming isn’t far-fetched—it might be right on schedule. Historically, major bull runs were preceded by periods of sideways drift and compressed volatility, frustrating investors before erupting into parabolic moves.
Today’s market mirrors those conditions, and CryptoCon believes Bitcoin could be in the early phase of that final, explosive ascent. The cryptocurrency’s price may still look tame, but the pressure beneath the surface is mounting.
If history continues to rhyme, Bitcoin isn’t just climbing—it’s preparing to soar. And if the cycle plays out as it has before, the number waiting at the top is clear: $184,181.


