


Bitcoin, the largest cryptocurrency by market cap, bounced 1.6% to hit the $107,820 mark on Wednesday, June 25th. The rebound came as investor anxiety over Middle East geopolitical tensions began to subside. The BTC recovery gained additional momentum from renewed whale activity and the formation of a bull-flag pattern, reinforcing the next breakout.
Whales Are Doubling Down on Bitcoin as Sentiment Turns Bullish
Over the last three days, the Bitcoin price has bounced from $99,750 to $107,721, representing an 8% gain. This bullish upswing was triggered by a Monday announcement by U.S. President Donald Trump that Iran and China have agreed to a ceasefire.
However, the optimism was short-lived, as the truce was breached the following day. Trump later warned that tensions between the two nations could escalate again “perhaps soon,” casting uncertainty in the market.
That said, the BTC price shows no signs of slowing down, with the bullish momentum holding strong as high-net-worth investors continue to ramp up their accumulation.
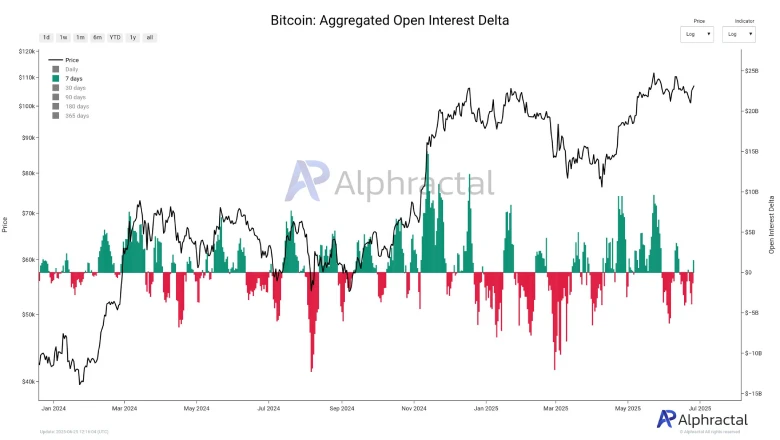
According to analytics platform Alphractal, the 7-day open interest delta has flipped positive, indicating that the large investors are significantly increasing their long positions. Despite the geopolitical tensions, this surge suggests that big-pocketed investors are confident in Bitcoin’s potential for growth.
Supporting the narrative is the whale position sentiment indicator, a powerful metric that combines the open interest with that of large quantity trades valued above $1 million.
This high-precision sentiment oscillator has consistently identified potential market tops and bottoms by tracking the behavior of major investors. Historically, this metric has shown a 93% correlation with Bitcoin’s price movements.
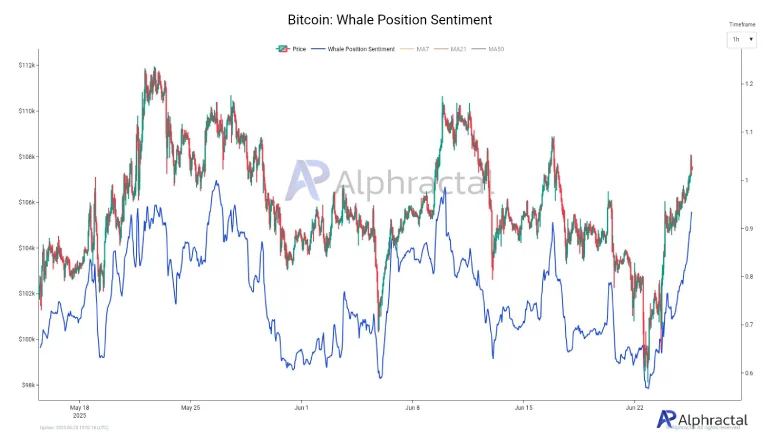
Thus, the current surge in this metric, along with price, could further bolster the bullish momentum. Conversely, if the metric shows a declining trend with rising prices, it suggests whales are opening short positions in anticipation of a reversal.
Bull Flag Pattern Sets BTC Rally For New High
Over the past six weeks, the consolidation trend in Bitcoin price has resonated strictly between two downsloping trend lines, indicating the formation of a bull flag pattern. Historically, this pattern has emerged in an established uptrend as it allows buyers the opportunity to replenish their bullish momentum.
Following the recent market reversal, the BTC price now trades at $117,509, standing just 1.3% away from challenging the overhead trendline.

A bullish breakout from the overhead resistance will signal the continuation of the prevailing uptrend and likely pierce the all-time high resistance of $112,000. If the pattern holds, it will drive an extended rally to a high of $136,732.
