





- Binance withdrew its MiCA license application in Greece ahead of the July 1, 2026, expiration of the EU’s transitional regulatory period.
- Despite regulatory concerns, on-chain data indicates Europe contributes only a small share of Binance’s overall trading activity.
- A megaphone pattern drives the current mid-term consolidation in the BNB price.
BNB, the native cryptocurrency of the BNB chain, is down 3.2% during Tuesday’s U.S. market session to exchange hands at $571.5. This downward trend is part of a market-wide sell-off, but Binance coin is seeing further declines as regulatory concerns impacting its European operations continue to weigh on the market. That said, the recent on-chain analysis reveals that EUR-denominated spot trading pairs account for a marginal volume on the exchange, making the notion of MiCa risk seem exaggerated.
Binance’s MiCA Setback May Have Limited Impact
Binance has officially pulled its application for a MiCA license from Greece, which expires on July 1, 2026, marking a major escalation in the cryptocurrency firm’s regulatory battles in Europe.
The move comes in response to coordinated resistance from regional regulators and as the EU’s groundbreaking crypto law mandates that all platforms obtain local approval to operate across the 27-member bloc. Binance stated that it will not exit the European market, but instead, it will abandon the slow-moving application in Greece and seek to obtain a license in another EU member state.
To ensure a smooth transition and to protect its users, the exchange announced via Binance Square that affected European clients will receive a comprehensive account update regarding their asset options and any required winding-down procedures before June 30, 2026.
Without a valid MiCA approval, Binance would be barred from offering services to users across the European Union’s 27 countries, potentially disrupting access for a significant portion of its customer base.
However, on-chain data analysis offered by CryptoQuant suggests that potential disruption in Binance’s European operations can have only moderate impacts on the platform’s overall activity. Binance’s total spot trading volume accounts for about 1% of all spot trading pairs in EUR.
The flow of deposits to the exchange reinforces this worldwide distribution. CryptoQuant’s shared hourly deposit chart for the top platforms reveals that Binance has consistently seen deposits made over the past 24 hours, with no noticeable surge occurring at any specific time.
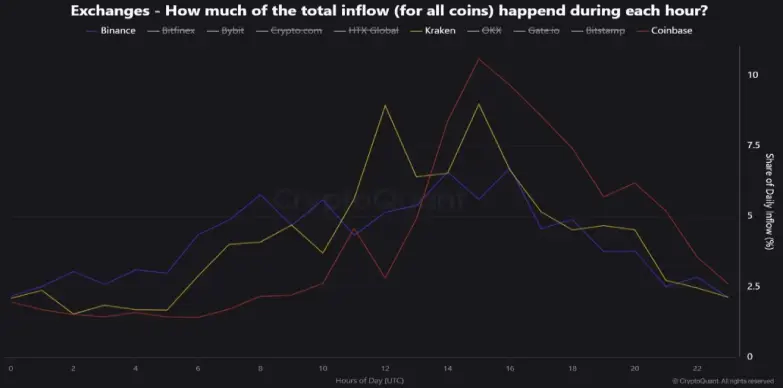
By contrast, Coinbase shows significantly higher volume inflows around the NYSE trading day, while Kraken’s patterns align more closely with overlapping European and American market sessions. Binance’s inflows look more evenly distributed, which suggests that it has a wider global user and capital base.
European users may move to exchanges more compliant with MiCA regulations, like Coinbase or Kraken, or another exchange approved by MiCA, but the immediate impact on Binance’s total trading volume, trading liquidity, and revenue can be limited.
BNB Price Coiling in a Megaphone Pattern Signals a Major Breakdown Ahead
Over the past four months, the Binance coin’s price action has projected a sideways trend around the $630 region amid increasing geopolitical and regulatory uncertainties. Interestingly, the price consolidation witnessed wider swings during each cycle, indicating the formation of a widely known pattern called an expanding channel or Megaphone.
Theoretically, this expanding range, marked by two diverging trendlines, also accentuates the rising uncertainty and lack of conviction from buyers or sellers. Following the June month correction, the Binance coin currently trades at $571.5, standing just 3.2% away from the pattern’s bottom trendline.
This potential retest is a turning point for BNB price prediction to decide its near-term course.
The RSI is nearing the oversold level of 37.5, pointing to further bearish momentum in price that may lead to a prolonged correction. A downtrend in the 20 and 50 daily exponential moving averages (EMAs) highlights an aggressive bearish price setup.
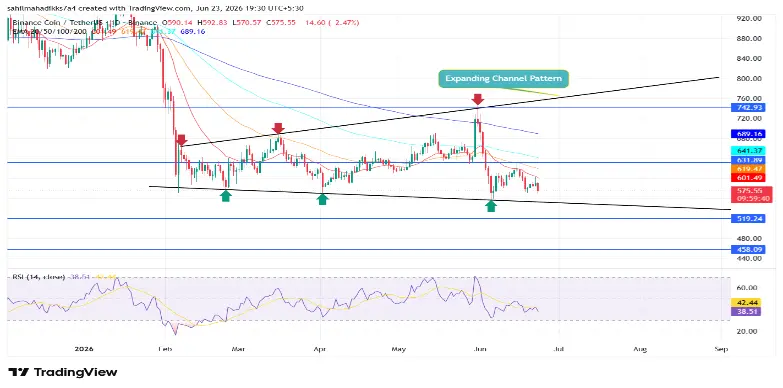
If the price of the BNB continues to fall, it may extend to $550 and make a faster way towards $458 or $400.
On the contrary, the support trendline has so far provided strong support to market traders. BNB buyers will be able to support the $550 level if the general market mood turns bullish again and tries to bounce back in the coming month.