Cardano (ADA) is developing serious momentum, and the price dynamics show that a breakthrough is possible, which can lead the token to new heights. As of press time, the cryptocurrency’s price stands at 0.859, approaching a critical resistance at 0.94. A breakout above this price may trigger a strong rally, opening a series of bullish objectives that extend to $3.16.
ADA Price Prediction: A Bullish Structure at Hand
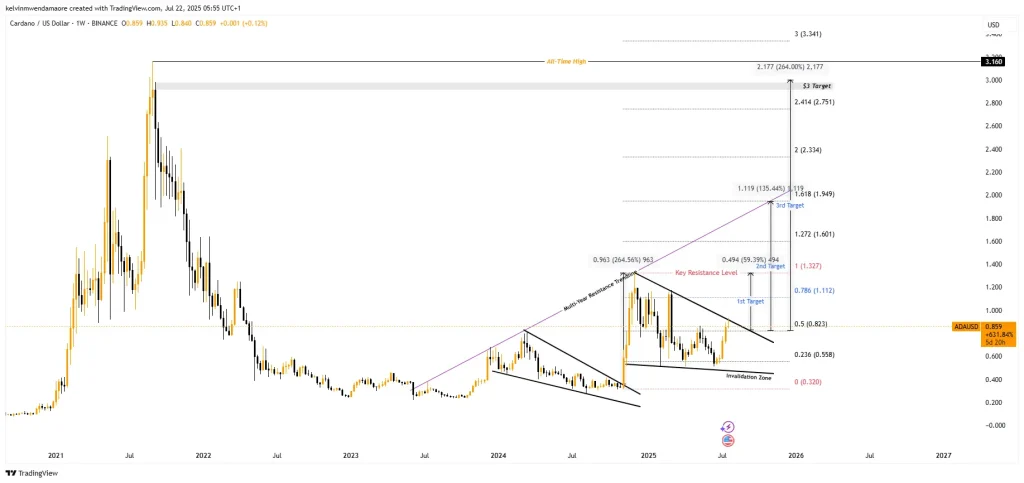
The recent ADA price update shows a classic bullish reversal at work. After months of consolidation under a descending trendline, the cryptocurrency broke free late last year, posting a massive 264% rally to a peak of $1.327. Such a step sealed a breakout of a multi-month resistance and validated the development of a falling wedge, a bullish chart pattern that is usually observed at the end of a downtrend.
Following a healthy retracement, the token’s price is once again coiling within a second wedge formation, pointing toward another potential breakout. The most significant resistance is the level of $0.94, which, if overcome, may serve as a catapult.

ADA Price Chart (Source: TradingView)
The ADA price forecast outlines multiple targets based on Fibonacci extension levels from the $0.32 low. These include:
- $1.32 as the first primary target (1.0 Fib)
- $1.94 as the next leg higher (1.618 Fib)
- $3.00 as the third key zone (just 4% shy of its all-time high)
Beyond that, continuation targets at $3.16 and $3.34 mark the upper bounds of this bullish structure, aligning with long-term price projections. The setup also incorporates an invalidation zone under the price of $0.55, which sets a definite boundary for revisiting the bullish ADA price forecast.
On-Chain Map Shows Bull-Bear Showdown for ADA
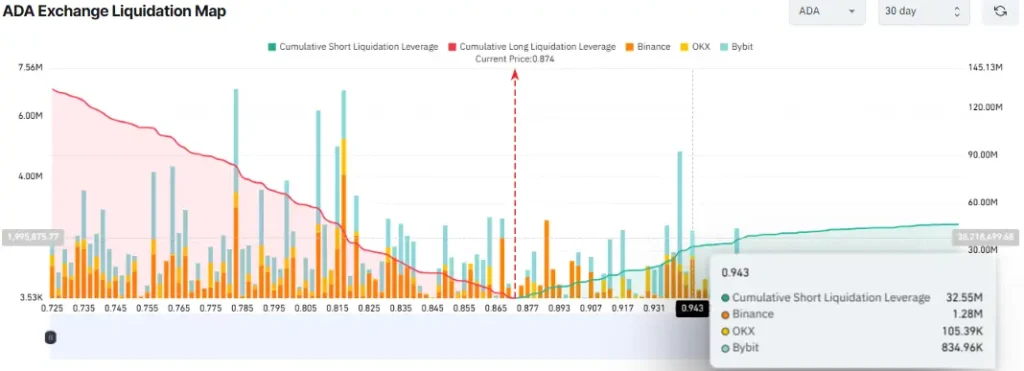
On-chain data continues to back a strong bullish case for Cardano, but not without key pressure points on both sides of the price spectrum. According to the ADA Exchange Liquidation Map, a massive cumulative buildup of short positions is concentrated between $0.89 and $0.94, with a key liquidation wall at $0.943.
ADA Exchange Liquidation Map (Source: CoinGlass)
At this level, over $32.55 million in cumulative short leverage is at risk. A clean breakout above this resistance may cause a strong short squeeze, driving the token to its initial technical target of $1.32.
Yet, the bullish momentum faces a pivotal test. Should ADA fall back to the support zone of $0.81, the situation reverses. On-chain metrics indicate that the level is heavily long-exposed, and a collapse would trigger a long squeeze of more than 42 million dollars. This would trigger mass unwinding of long positions, which could halt or reverse the altcoin’s bullish trend.
ADA OI-Weighted Funding Rate (Source: CoinGlass)
Fueling the bullish story, ADA’s OI-weighted funding rate is now at 0.0249%, which is an evident indicator that long traders are in the lead and ready to pay a premium to short traders to remain in their positions. This consistent premium indicates increasing confidence within the derivatives market.


