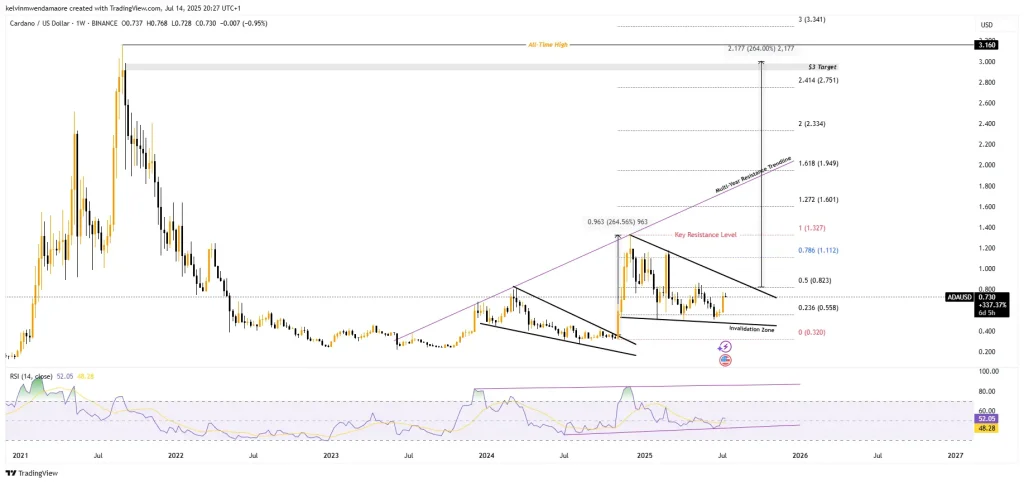
Cardano (ADA) is beginning to exhibit early signs of a decisive breakout, as its recent price analysis indicates a possible rally to a high of $3, just 4% below its all-time high. The weekly chart shows a typical falling wedge formation, which tends to be a harbinger of a bullish turnaround.
In a familiar setup, ADA previously broke out of this pattern and surged to a peak near $1.327. Now, the pattern is resurfacing, and so is momentum. From a recent low of $0.511, the token has climbed 44% to its current price of $0.737, reigniting hopes of another major rally.
ADA’s Price Action Echoes Past 264% Surge
The cryptocurrency’s price is now approaching key Fibonacci resistance zones at $0.823 (0.5), $1.112 (0.786), and $1.327 (1.0)—the same level that marked the prior breakout high. This range could act as a battleground for bulls and bears alike. However, given that the altcoin has the potential to clear the $1.327, bull pressure is likely to ensue, allowing the next higher leg. For more insights, check out our detailed Cardano crypto price prediction.
Traders are carefully eyeing the 1.618 Fibonacci level around 1.949, i.e., an area that coincides with a multi-year bearish trendline. This area is expected to act as a strong resistance ceiling. Only a decisive break above this confluence point would pave the way for a full-blown push toward the $3 mark, a move that once again mirrors the previous 264% rally.

ADA Price Chart (Source: TradingView)
On the other hand, focus is also on $0.450, the so-called “Invalidation Zone.” A breach below this level will invalidate the bullish position and may prelude the alteration of the breakout condition. Bullish momentum indicators are also shifting in favor.
The relative strength index (RSI), for instance, is on the rise, currently at 52.05, expressing the interest of potential buyers and the possibility of relieving the model of a neutral state. With a confluence of technical patterns and ticking momentum, ADA may be setting up its step to a significant price breakout, but strictly when substantive resistance is breached.
Whale Activity in ADA Futures Heats Up
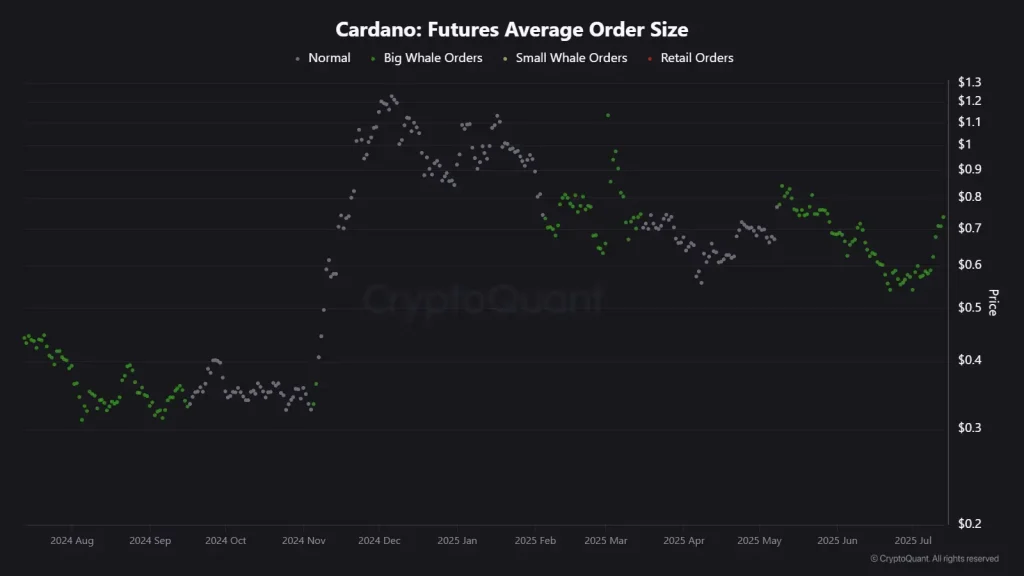
On-chain metrics are also adding weight to the bullish setup forming on Cardano’s (ADA) price chart. Beneath the surface, futures data is lighting up with signs that big players are quietly loading their bags—a familiar move that preceded the cryptocurrency’s last major rally.
ADA Futures Average Order Sizes
In the Futures Average Order Size chart, a sharp shift in behavior stands out. Green dots—representing large whale orders—have reappeared just as the token pushes above $0.70. This mirrors the accumulation seen before ADA’s surge to $1.327, when whales made their move early, ahead of the retail frenzy.
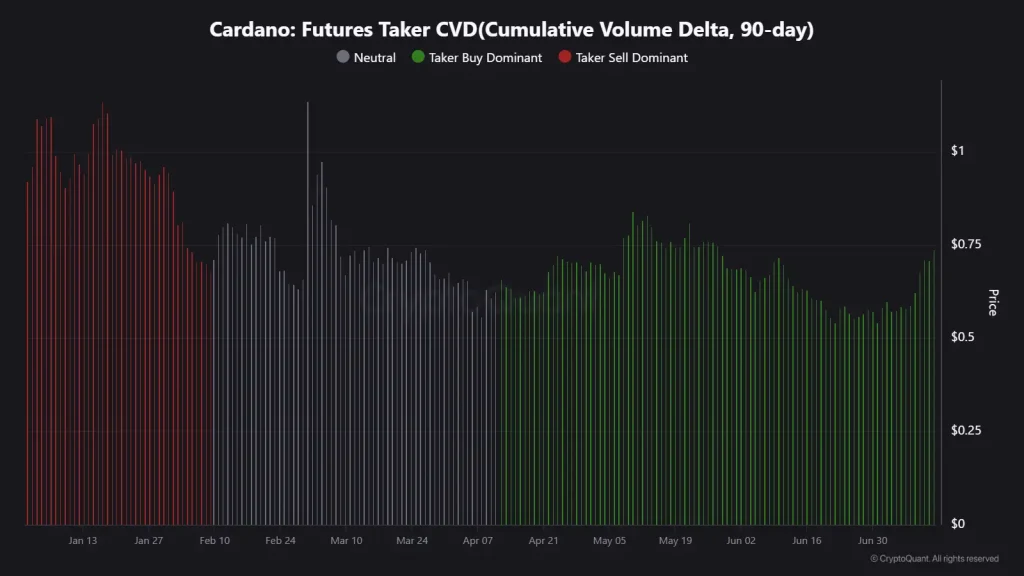
That pattern is playing out again—quietly but confidently. However, this isn’t just an isolated interest. The Futures Taker CVD (Cumulative Volume Delta) tells the rest of the story. After a months-long stretch of seller control (highlighted by red bars), the tide has turned. Since April, aggressive buying has dominated the futures market.
Cardano Futures Taker CVD
Buyers are stepping in with conviction, steadily pushing the volume delta into the green, while ADA’s price climbs in tandem—a strong sign of healthy demand. Put simply, smart money is stepping in, and they’re doing it before the breakout becomes obvious.


