


XRP today experienced a sudden sell-off during U.S. market hours. With a 2% intraday decline, the coin price reverted from $3.30, experiencing a long wick rejection. While the pullback followed broader market momentum, a massive spike in trading volume on the Korean exchange Upbit signaled an increase in investors’ interest towards this asset or a potential move ahead.
XRP Today Tops UPBIT Trading Volume, Surpasses BTC and ETH
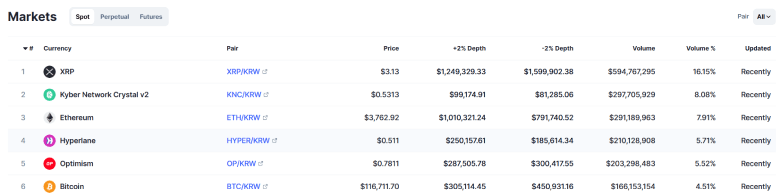
On Monday, July 28th, a majority of major cryptocurrencies, including XRP, experienced a brief pullback. Amid this reversal, the XRP surged to the top of the trading chart on South Korea’s largest cryptocurrency exchange, Upbit, surpassing Bitcoin and Ethereum.
According to CoinMarketCap data, XRP today recorded $594.7 million in trading volume, accounting for 16.15% of the platform’s total market share. This development marks the growing traction of Ripple Crypto in the Asian market, possibly due to increasing institutional interest and speculation surrounding ETFs.
While the increasing volume indicates rising investor interest, it may struggle to hint at the potential direction of the market. Thus, the current holders must brace for the volatility if this trend continues.
XRP Price To Test Key Fibonacci Supports
XRP today shows a long rejection candle from the $3.3 level, indicating the intense overhead supply. In the daily chart, this reversal forms a fresh lower high, which signals a sell-the-bounce sentiment in the market, typically observed in an established downtrend.
The sellers also regained control over the 20 and 50 EMAs on the 4-hour timeframe, highlighting rising selling pressure in the near term. With sustained selling, the Ripple Crypto is likely to plunge another 5.5% to retest the $38.2 Fibonacci requirement level at the $3 psychological level.
A potential breakdown below this level would accelerate selling pressure and push the price against the 50% retracement level at $2.80.

On the contrary, for buyers to reclaim their grip over the asset, the price must breach the overhead downsloping trend line, which reflects the current pullback.
