XRP, the native cryptocurrency of the XRP ledger, shows a 0.44% jump during Wednesday’s U.S. trading session. This uptick lacks momentum as crypto investors continue to struggle with FUD (fear, doubt, uncertainty) amid escalating military action in the Middle East. Thus, the Ripple cryptocurrency could extend its short-term consolidation above the $1 support level in June, but the price indicates an opportunity for a high-momentum rally as a bullish continuation pattern emerges.
According to CoinGecko data, the XRP coin currently boasts a market cap of $128 billion, while the 24-hour trading volume is at $2.82 billion.
Bearish Reversal Sets Ripple Coin for $1.6 Pullback
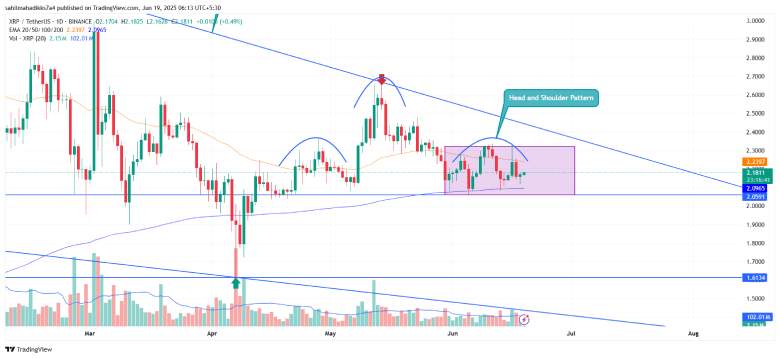
Over the past month, the XRP price has plunged from $2.65 to $2.16, accounting for an 18.6% loss. This correction trend has recently shifted its trajectory sideways as buyers are actively defending $2 psychological support.
The daily chart analysis of this consultation reveals a potential formation of a traditional reversal pattern known as a head and shoulders. This structure is typically identified by three peaks: the central peak (head) flanked by two smaller highs (shoulders).
As market sentiment continues to wobble amid escalating military action in the Middle East, the Ripple cryptocurrency could continue to hold above the $2 support level and the overhead resistance trendline.

The 200-day exponential moving average, wavering at the $2 neckline, has created a strong support zone and a crucial pivot level for XRP holders. If the bearish momentum accelerates, the coin sellers would flip the bottom support into a potential resistance, signaling the continuation of the correction trend.
The post-breakdown fall could plunge the asset price another 21% and hit the support at $1.61.
XRP Price Hints Major Breakout Amid Flag Formation
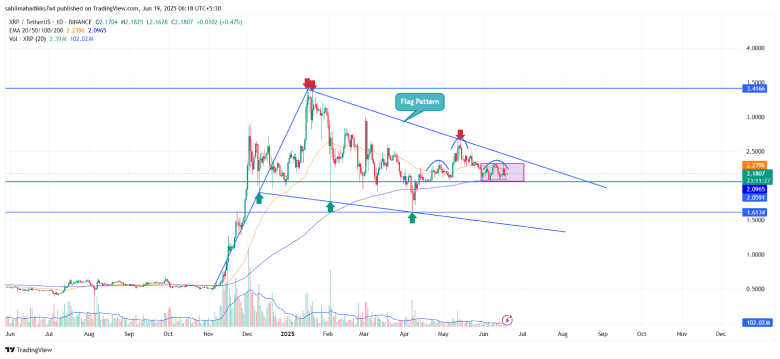
The short-term outlook for the XRP price indicates a bearish trend ahead, amid the formation of an H&S pattern and geopolitical tensions. However, a broader analysis of the daily chart reveals the formation of a bullish continuation pattern known as a ‘Flag.’
The chart setup is characterized by a long pole that demonstrates the dominating trend in price, followed by a temporary correction within two trendlines to recuperate the exhausted bullish momentum. Since mid-January, the XRP price has been resonating strictly within these downsloping trendlines, preparing for its next recovery leap.
If the pattern holds true, the coin price could bounce immediately from the anticipated correction to $1.61 or $1.40 support, re-challenging the overhead resistance trendline. A bullish breakout from the flag resistance with a weak candle closing will signal the end of the ongoing correction.
The post-breakout rally could boost the Ripple coin to $3.4 high, followed by a leap above the $4.00 mark.
Also Read: US DOJ to Seize $225 Million in Crypto From Investment Scams


