XRP, the native cryptocurrency of global payment company Ripple, shows a slight downtick of 0.37% to currently trade at $2.18. The selling pressure in the broader crypto market has currently cold-off as Bitcoin holds above the $82,000 mark. However, the XRP price faces a risk of major support breakdown as the network activity plunged and a bearish chart pattern emerged.
Key Highlights:
- An inverted head and shoulder pattern set the XRP price for a decisive breakdown below $2.
- The correction in Ripplr crypto could witness demand pressure at $1.63 and $1.28.
- Glassnode data shows a 50% drop in active addresses on the XRP network..
XRP Faces Bearish Pressure as Active Addresses Halve Since December
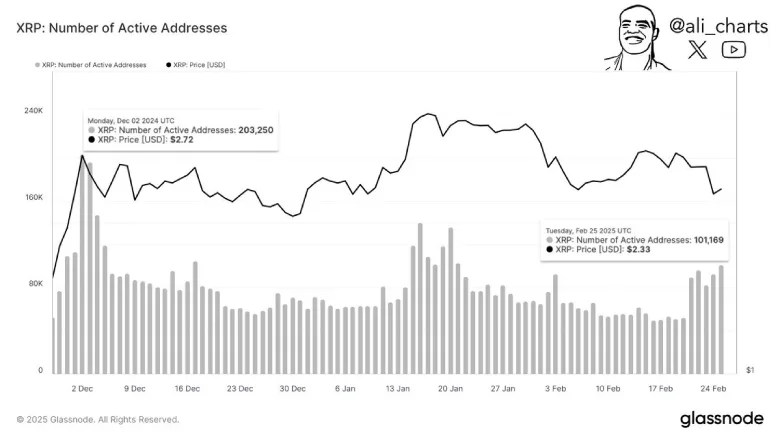
In the past three months, the XRP price showcased a sideways action, struggling to sustain above the $3 psychological level. Amid the consolidation, the XRP network is witnessing a significant decline in activity, as the number of active addresses has dropped by 50%, according to Glassnode data.
Crypto analyst Ali Martinez highlighted the sharp downturn in a post, noting that XRP’s active addresses have plummeted from 202,250 in December 2024 to just 101,169 as of February 26, 2025.
The drop in active addresses suggests waning engagement within the XRP ecosystem, potentially pointing to lower transaction volumes or reduced participation from retail and institutional players.
If the trend continues, the XRP price could struggle to gather recovery momentum and give in to the market’s selling pressure.
Head & Shoulder Pattern Hints Major Breakdown Ahead
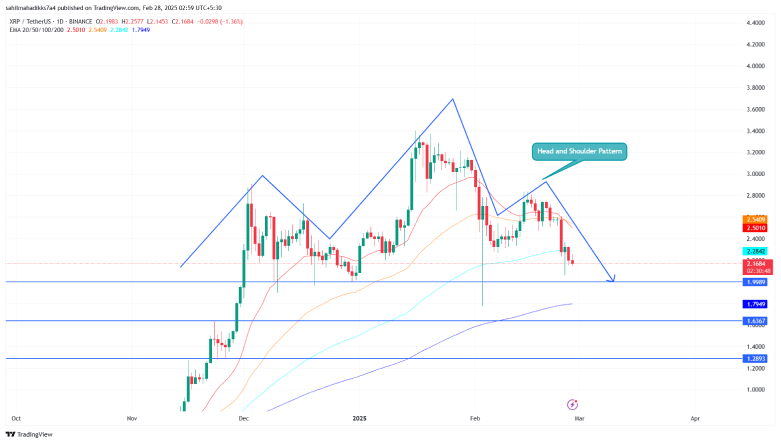
The XRP’s daily chart analysis shows the formation of a renowned reversal pattern called head and shoulders. This setup features a central peak (head) flanked by two nearly equal smaller peaks (shoulders), signaling potential bearish momentum.
Typically, this chart pattern is observed at major market tops as it indicates a surge in overhead selling pressure. Currently, the XRP price trades at $2.15, some 6% short from a breakdown below $2 neckline support.
With the declining trend in network activity and price drop below key daily EMAs (20, 50, and 100), the coin price shows a higher potential for bearish breakdown.

A successful flip of neckline support into potential resistance will accelerate the correction to the bottom floor of $1.63, followed by $1.28.
Also Read: Chainlink Price Eyes $20+ as 62M Token Supply Defends Key Demand Zone


