


XRP, the native cryptocurrency of the XRP ledger, experienced sharp volatility during Thursday’s U.S. market and is currently trading at $3.18. The daily chart displays a wide price spread, ranging from $2.95 to $3.26, accompanied by a neutral doji candle, suggesting a lack of momentum from both buyers and sellers. Despite the uncertainty, the Ripple cryptocurrency outperforms the general market movement and exhibits stable on-chain growth, fueling its rally.
XRP Gaining Traction Against Bitcoin
Over the past three weeks, the XRP price has experienced a massive rally, rising from $2.2 to a high of $3.66, representing a 66% increase. This buying pressure likely followed broader market momentum as the U.S. House of Representatives passed three highly anticipated crypto bills.
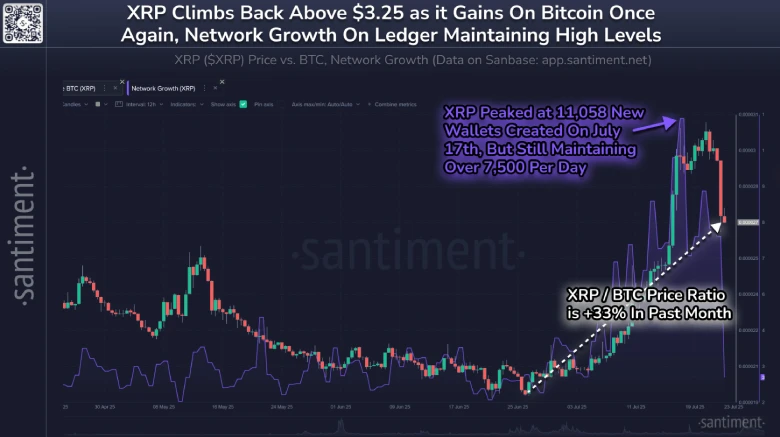
However, the Ripple crypto gained significant ground against Bitcoin, as the XRP/BTC ratio is up 33% since last. Additionally, the Santiment data shows a notable surge in XRP’s daily wallet creation, which recently peaked at 11,058 on July 17. The metric continues to maintain its daily average of over 7,500 new wallets, indicating ongoing adoption and the strength of its ecosystem.
If the trend persists, this altcoin shows a higher potential to show resilience amid volatility and drive a bullish rebound.
XRP Price Resonates Between Key Fibonacci Levels
Over the past two weeks, the XRP price showcased a sharp correction from $3.65 to $2.95, accounting for a 19% loss. The pullback indicates a post-rally correction, as short-term investors could be booking their profits.
In the intraday chart, the coin shows a bullish bounce from the 38.2% Fibonacci retracement level to currently trade at $3.13. Historically, the Fibonacci levels have served as suitable support for buyers to recoup their bullish momentum before the next leg up.
Currently, the Ripple crypto shows a short fluctuation between the 23.6% and 38.2% FIB levels, which also coincides with the 50- and 100-day exponential moving averages, respectively. If the coin breaks above the overhead resistance at $3.25 and reclaims the aforementioned 50-day slope, the buyers regain their momentum.
The potential breakout could drive a 12.67% surge to challenge the $3.65 resistance, followed by a leap to $4.

On the contrary, if the price breaks below the $3 support, the sellers could drive an extended correction trend.
