During Wednesday’s trading session, the cryptocurrency market recorded a notable surge in volatility, evidenced by the long-wick rejection candle in Bitcoin. The market fluctuation followed the newly announced reciprocal tariff for a range of countries by Donald Trump. Interestingly, the market uncertainty surged as the BTC price grappled with a key resistance trendline, signaling the risk of another correction.
Key Highlights:
- U.S. President Trump’s announcement of reciprocal tariffs on a range of countries could escalate market volatility.
- Bitcoin price reversal within the wedge pattern could drive a 14% fall
- A bullish breakout from the overhead trendline is needed to end the three-month correction.
Escalating Tariffs and Their Potential Impact on Bitcoin Price
On Wednesday, April 2nd, 2025, the United States President, Donald Trump, announced a baseline tariff on all imports and higher duties on some of the country’s biggest trading partners.
These sweeping tariffs are likely to erect new barriers around the U.S. economy, which would undo trade liberalization efforts that have shaped the global economy for decades. While the move could increase domestic production and reduce dependency on foreign goods, it will likely provoke retaliation from other nations.
The potential countermeasures may significantly raise the cost of goods for American consumers, ranging from basic utilities to luxury items like wine.
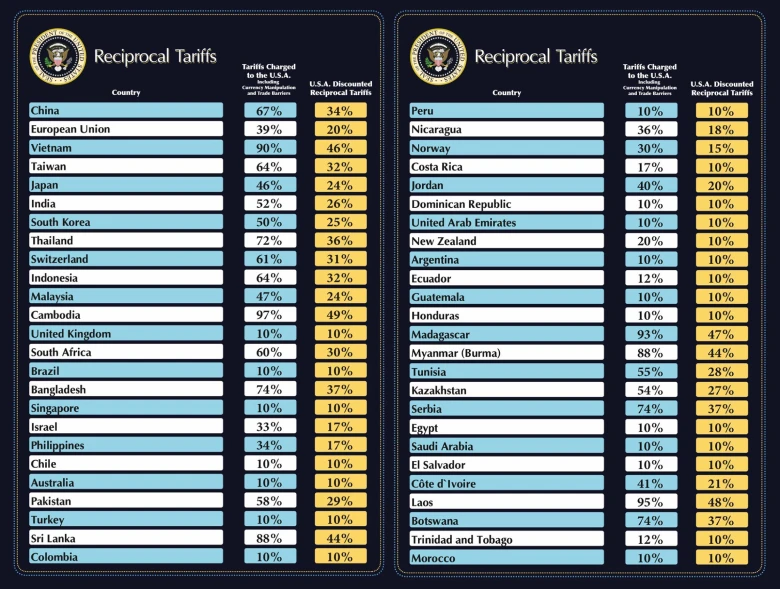
According to Trump’s poster on reciprocal tariffs, Cambodia and Vietnam will see tariff rates as high as 49% and 46%, respectively, while China will be subject to a 34% reciprocal rate.
Other nations such as Thailand will face a 36% tariff, while Japan and Malaysia will be imposed with a 24% tariff. However, the United Kingdom, Brazil, and Singapore will have a reciprocal tariff of 10%.
The escalating tariff tension could slow down international trade and negatively affect economic growth.
Bitcoin Price Hints at Reversal Within Wedge Pattern
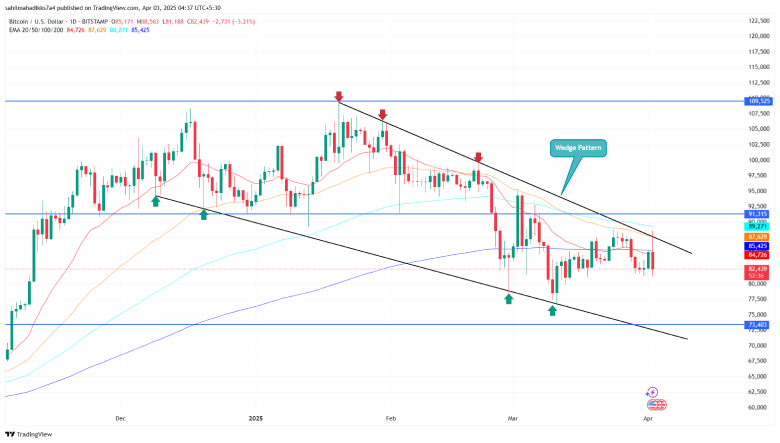
Amid the early-day upswing, the Bitcoin price teased a bullish breakout from the resistance trendline of the falling wedge pattern. Since January 2025, the pattern’s two converging trendlines have acted as dynamic resistance and support, leading to a sustained downtrend.
With an intraday loss of 2.5%, the BTC price marks another reversal from the overhead trendline. Historical data shows a bearish reversal within the wedge pattern has led to a downfall ranging from 16-22%.
Thus, with sustained selling, the coin price could plunge around 14% and retest the support region at around $70,000.
Alternatively, the buyers must breach the overhead trendline to regain control over this asset and drive a sustained rally.
Also Read: BlockFi Sets Final Deadline for Bankruptcy Claims: May 15, 2025


