


ETH, the cryptocurrency of smart contract giant Ethereum, fell over 3% during Tuesday’s U.S. market session. This downtick suggests that ETH is struggling to sustain itself above $2,500 and risks a prolonged correction, as the price follows a sell-the-bounce sentiment. Will sellers’ dominance persist, or do historical trends signal an opportunity for recovery?
History Repeats? What Past Julys Tell Us About ETH Moves
One of the core principles of financial market trading is that ‘history repeats itself. It means that the historical trend can serve as an indicator of potential market movements. While it does not offer a guarantee, it increases traders’ conviction in a particular movement.
Thus, analyzing Ethereum’s price behavior from the previous year could provide a useful perspective on what to expect this month. According to CoinGlass data, ETH performance in July has shown a pattern of inconsistency over the past several years.
Between 2016 and 2019, the coin’s price experienced notable losses, ranging from 5% to 25%. However, the trend shifted from 2020 to 2022 as coin holders witnessed a strong recovery of over 50% in July.
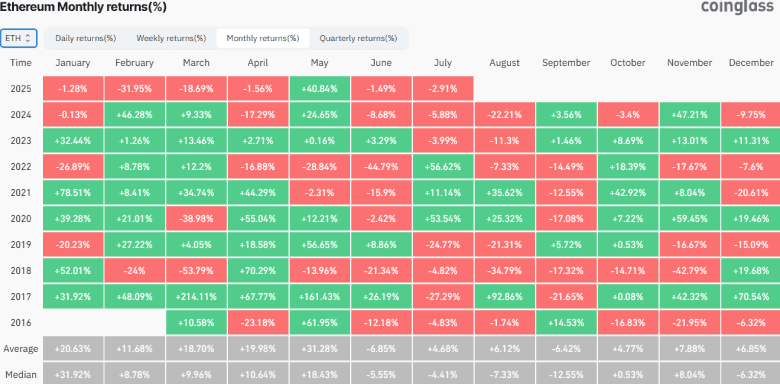
That said, the last two years showed a marginal loss of 4% and 5.88% in July 2023 and 2024, respectively. These alternative trends indicate a lack of consistency in ETH this month, and therefore, traders should adopt a cautious approach.
The average return of the last nine years shows a 4.68% gain; this altcoin could record a slight uptick in July.
Ethereum Price Breaks Below Collective Support
By press time, the Ethereum price is trading at $2,405 and showing an intraday loss of 3.7%. The daily bearish candle completes an evening star candle pattern at the weekly resistance of $2,500, signaling overhead supply pressure.
The declining price currently offers a bearish breakdown from a key support region of $2,420 along with the 50- and 200-day exponential moving averages. The daily candle closing below this support will reinforce the bearish momentum and potentially form a lower high in the technical chart, signaling bearish market dynamics.
With sustained selling, the Ethereum coin could lose 12% and retest the $2100 floor.

On the contrary, the buyers must breach the multi-month resistance from the downsloping trendline to regain bullish momentum.
Also Read: SEC Approves Grayscale’s Multi-Asset Crypto Spot ETF
