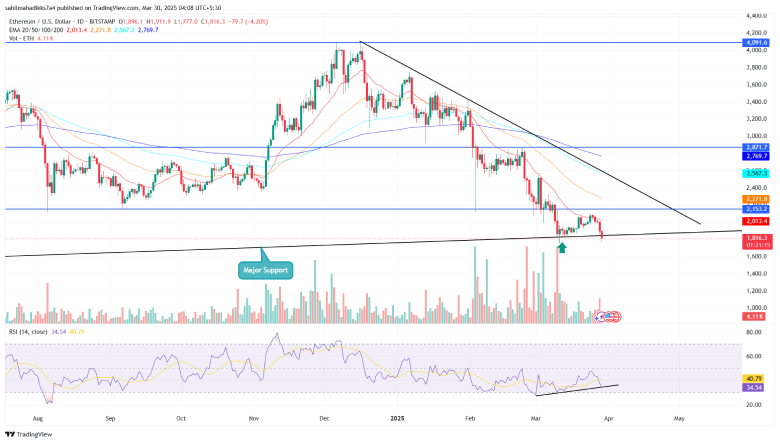
On March 29th, the Ethereum price plunged +3% to reach the current trading price of $1,843. This selling pressure accelerated with the U.S. government announcing new tariffs on different industries and a Bitcoin reversal below $85,000. Amid the renewed correction, the Ethereum price retested a long-coming support trendline signalling the potential bullish counter as whale accumulation resumed.
Key Highlights:
- Whale accumulation of 29,341 ETH worth $58.18 million boosts confidence in Ethereum.
- An ascending support trendline in the daily chart drives the current uptrend in the Ethereum price
- A bullish divergence in the momentum indicator Relative Strength Index signals a reversal opportunity in the ETH coin.
Whale Accumulation Signals Confidence in ETH’s Long-Term Outlook
In a six-day downfall, the Ethereum price plunged from $2,103 to $1,836 current trading value, registering a 12.8% fall. Despite this downturn teasing a bearish breakdown from the long-coming support trendline, the onchain data revealed a substantial purchase of 3,195 ETH (worth approximately $5.97 Million) by large-scale investors on a Saturday morning.
According to a tweet from Lookonchain, this whale has been accumulating Ethereum since March 26. In total, the whale has acquired a massive 29,341 ETH, which amounts to approximately $58.18 million. The buying spree reflects the growing confidence in Ethereum as a long-term investment.
Ethereum Price Teases Multi-Year Support Trendline
The Ethereum price analysis of the daily chart shows a bullish retest to the support trendline coming back from March 2020. This dynamic support has acted as a major accumulation zone for buyers as the previous reversals led to an upswing ranging from 365% to 1,700%.
Concerning the ETH price retest to this ascending trendline just three weeks ago, the RSI slope shows a notable surge, indicating the intact demand pressure from below. If the theory holds, the coin price will likely hold $1,800 and prevent a breakdown below $1,500.

In an optimistic scenario, the price reversal could push the asset up 23% to challenge the resistance trendline (Black), carrying the current correction trend. A potential breakout could signal a change in market dynamics.
On the contrary, a weekly candle closing below the aforementioned support trendline will invalidate the bearish thesis for a prolonged downfall.
Also Read: Dogecoin Price Faces +30% Fall Amid Major EMA DeathCross of 2025


