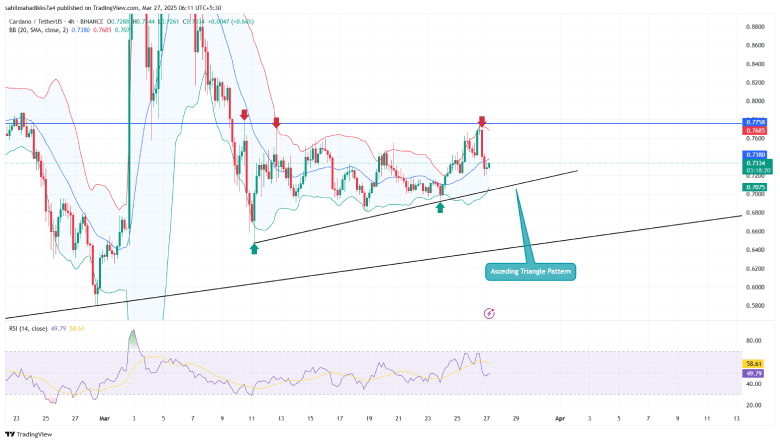
On Wednesday, March 26th, the Cardano price plunged over 2% to reach its current trading value of $0.729. The downtick likely followed a 25% tariff by United States President Donald Trump on all foreign-made cars. While selling pressure signals the continuation of the current consolidation trendline, a deeper analysis of the lower time frame reveals an impending breakout opportunity amid a bullish pattern.
Key Highlights
- The Cardano price potential breakout from the ascending triangle pattern will realize its market uncertainty and drive a sustained recovery.
- The $0.77 stands as immediate resistance against ADA buyers for a leap toward $1.
- A fall below triangle support would invalidate the bullish outlook and trigger a further correction.
Cardano Price Signals Major Breakout
Over the past two weeks, the crypto market witnessed a renewed recovery trend following Bitcoin’s price attempt to reclaim $90,000. However, the Cardano price continued its consolation below $0.77 resistance, signaling weakness in buyers’ conviction.
However, an analysis of a 4-hour chart shows the ADA price resonated strictly within a horizontal resistance of $0.775 and a resign trendline, revealing the formation of an ascending triangle pattern. Theoretically, this chart setup is commonly observed between an established uptrend and offers a temporary halt for buyers before a major breakout.
Currently, the Cardano price trades at $0.726 and heading toward the pattern’s bottom trendline. If history repeats, the coin price should recuperate the bullish momentum at the aforementioned support and prepare for its next breakout.

A potential breakout from $0.77 resistance will accelerate the buying pressure as it releases the asset from market uncertainty. The post-breakout rally could push the price 15% up to challenge the resistance at $0.9, followed by a leap to $1.03.
On the contrary, a breakdown below the support will invalidate the bullish theses and drive extended correction.
Technical Indicators:
Bollinger Band: The squeezed range of the Bollinger Band indicator hints at an impending breakout in the ADA price.
Relative Strength Index: A rising trend of the RSI slope hints at increasingly bullish momentum amid current market consolidation.
Also Read: Bitcoin Correction Ending? Major Firms Load Up as BTC Preps for Breakout


