During Tuesday’s U.S. trading session, the crypto market recorded dried-up volatility as displayed with a neutral candle formation in Bitcoin. The market selling pressure subsided as several nations approached President Donald Trump to negotiate new trade deals. While the broader market uncertainty persists, the SUI shows significant resilience as Canary files for an SUI exchange-traded fund (ETF) with CBOE.
Key Highlights:
- An SUI price reversal from the support trendline of a falling wedge pattern signals a quick 20% surge in the near future.
- The rebound comes as Canary files for a regulated SUI ETF with CBOE.
- The bearish alignment between the daily exponential moving average (20<50<100<200) indicates the broader market trend is bearish.
Canary ETF Filing Fuels Bullish Sentiment
In April’s second week, the crypto market remained on the edge as the ongoing tariff war continued to charge selling pressure in the global market. While the uncertainty persists, the SUI price shows a quick rebound from $1.71 to $2.03 in the last 48 hours, accounting for a 17.8% surge.
Supporting the bullish clue, the digital asset management firm Canary has reportedly filed for an SUI ETF with the Chicago Board Options Exchange (CBOE). The ETF will provide regulated exposure to the native cryptocurrency of the SUI network.
According to the filing, the trust may stake a portion of its SUI holdings through trusted staking providers.
“The Sponsor may stake, or cause to be staked, all or a portion of the Trust’s SUI… The Trust would receive all or a portion of the staking rewards generated through staking activities, which may be treated as income to the Trust,” the filing states.
If approved, the SUI ETF would attract institutional investment and raise market visibility for this layer-1 network.
SUI Price Hints Reversal Within Wedge Pattern
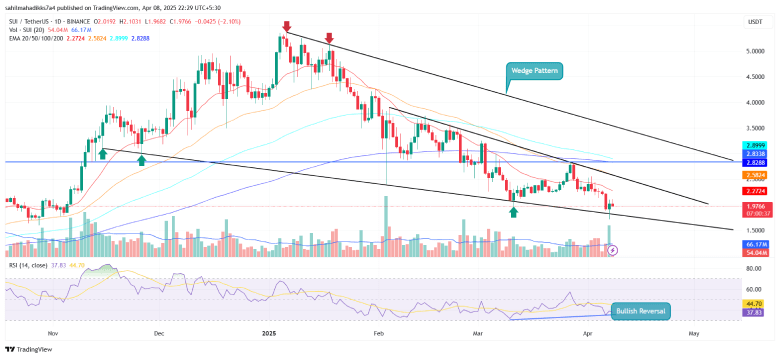
The SUI price analysis of the daily chart shows a bullish rebound from the support trendline of the wedge pattern. Since November 2024, the coin price has been resonating within the two converging trendlines, which provide dynamic resistance and support.
Historically, a reversal from the lower boundary has bolstered a bullish recovery ranging from a 44% to 80% surge, indicating a high accumulation zone for buyers. The daily RSI slope forming a higher low formation concerning the price retest to support the trendline indicates a higher potential for a bullish rebound.

If the theory holds, the SUI price rises 20% and breaches a short-term correction trendline at $2.43. The potential surge will reclaim fast-moving EMAs (20 and 50), accelerating the buying momentum for a higher surge.


