- Sui price forms cup-and-handle, triangle hinting bullish breakout.
- Sustained accumulation may push Sui price toward $7.90–$11.70.
- Technical indicators points bullish trend on the 4-hour chart.
Sui (SUI) price has maintained strong momentum after a recent bullish rally, currently holding above the $3.80 mark. The surge follows gains across the broader cryptocurrency market, with Bitcoin and Ethereum also posting notable increases. SUI experienced a slight consolidation before sharply jumping out of the previous sell-off levels. The rebound has encouraged traders, as the indications in the market depict that there is a chance of a long-term bullish rebound.
Sui Price Prepares for Major Technical Breakout
Crypto analysts report that the Sui price has been indicating that it could have a bullish breakout. The analyst points out a cup-and-handle formation as well as a converging triangle with very uptrend movement. The technical signals that exist currently give an indication of the price rally that might be heading towards the $7.90 to $11.70 levels in the short run. The trend is reinforced with continued price accumulation, price contractions, and this could indicate an eventual explosion should the resistance be breached.
JUST IN:$SUI Eyes Breakout: Cup & Handle + Triangle Setup Points to $7.90–$11.70 Target 🚀 pic.twitter.com/jgk0wIMQHO
— Sui Intern (@suintern_) August 14, 2025
The structure shows that there is increasing interest in the market where the coin is consolidating at critical points of breaking out. The move is gaining some attention by traders, who want some confirmation on it, and the formation fits with some previous iterations of historical bullish continuation pattern. Trending momentum would see the estimated breakout boosting $SUI into its target range and poise as one of the more practical setups in the altcoin market this season.
The derivatives market in Sui has experienced a steep increase in the trading position. The most recent data indicate that the daily volume has increased by 18% to reach a total of $8.52 billion. This increase indicates an upward trend in traders’ activity and the increase in short-term motion in the market.
Nonetheless, open interest in Sui derivatives recorded a loss and decreased by 4.23% to 1.95 billion. This decrease may reflect a slight profit level taking provision or fall in the long-term positions, with a combined mood to that of the recent jump in volume.
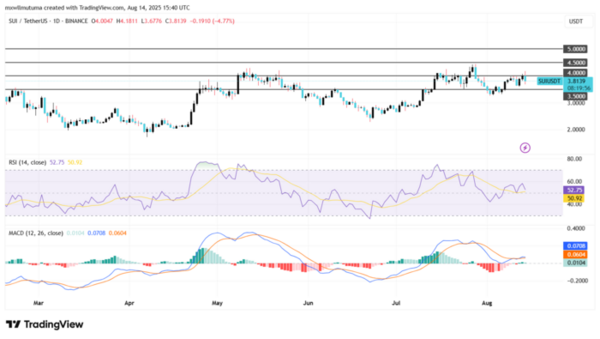
SUI Price Faces Resistance at $4, Support Holds
The SUI price hovered at $3.80 after a massive surge earlier this month pushed it above $4.00. However, the token faced renewed selling pressure today, dipping nearly 5% in 24 hours.
The Relative Strength Index (RSI) is sitting at the 52.61 level, indicating a neutral position with the absence of overbought or oversold extremes. This indicates that there exists flexibility of prices to move either upwards or downwards, depending on the market drivers.
The Moving Average Convergence Divergence ( MACD ) indicates a weak bullish crossover, since the MACD line is closely above the signal line.

Should bulls sustain the gains above $3.80, it is possible that we could see a retest of the $4.00 resistance level in the upcoming few sessions. A strong daily close above that mark could open the door to a rally to $4.50 and maybe even to $5.00. Failure to maintain 3.50 support, however, will turn the short-term trend and pull the price back into a lower consolidation range.


