- Bitcoin price to test $88,000 after its major breakdown from the long-coming support trendline
- Bearish commentary currently outweighs bullish sentiment across X, Reddit, Telegram, and similar channels.
- BTC’s fear and greed index plunged to 14%, highlighting extreme fear among market participants.
The Bitcoin price tumbled another 2.4% on Friday, November 21st, to reach a trading value of $84,419. The current correction momentum continues amid macroeconomic jitters, ETF outflows, long-term holders selling, and a liquidation cascade. Sentiment analysis derived from various social media platforms plunged to a level not seen in 2 years, signalling extreme fear among retail investors. As the BTC ETF buyers are nearing their pain threshold level, the coin price faces the risk of a prolonged downtrend.
Social Sentiment Hits Worst Level Since 2023 as BTC Loses Momentum
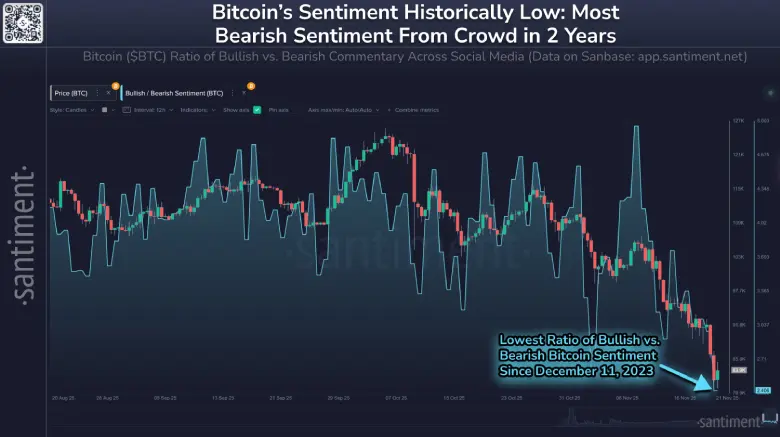
Over the past six weeks, the Bitcoin price has witnessed a steady downtrend from its all-time high of $126,272 to its current trading value of $84,925, registering a 32.8% loss. The downswing has plunged market sentiment on social platforms to its lowest point since mid-December 2023, as data from Santiment shows.
The ratio between the positive and negative mentions across X, Reddit, Telegram, and other large channels now represents general disapproval among smaller traders, indicating the strongest capitulation signal in almost 2 years.
Separate monitoring of the tone of discussion indicates that more crowdsourced bearish comments are outweighing bullish posts, which is usually seen near local price lows.
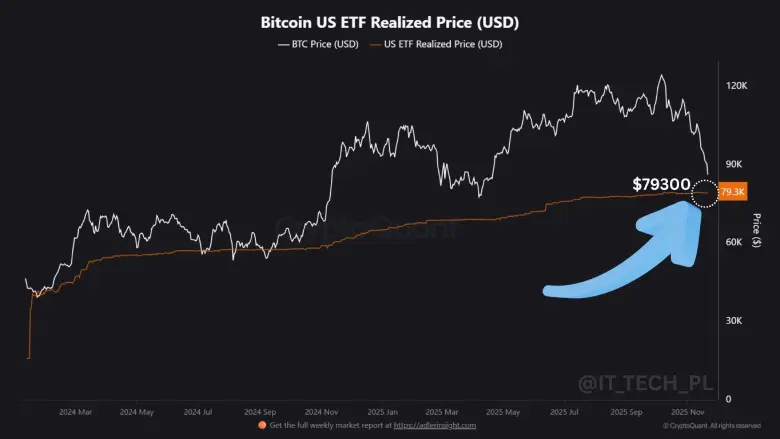
Furthermore, a tweet by analysis from ITTech identifies that most of the capital that has flowed into spot Bitcoin ETFs since their launch has flowed from individual investors using typical brokerage accounts, rather than from traditional institutional investors. These buyers have only known the asset in a rising market since the beginning of 2024.
The current on-chain realized price for the whole Bitcoin holder base is close to $79,300. As long as the market price remains above that price, the average holder is still making a profit. A move below it for an extended period of time would see most addresses move into unrealized loss for the first time since the 2022 bear market.
Market participants point out that many of the more recent buyers of ETFs have never experienced an extended crypto correction. A drop that puts their positions underwater could cause accelerated selling from this segment, which has yet to be faced with a serious drawdown.
Observers are, however, paying attention to the $79,300 zone as the closest psychological and cost basis support level that could mean the difference between containment of the selling pressure or a sharp acceleration of it in the next few sessions.
Bitcoin Price To Retest $88,000 Level as Potential Resistance
With today’s decline, the Bitcoin price plunged to an intraday low of $80,535 before reverting to $85,295. This reversal created a long-tail rejection candle in the daily chart, indicating intact demand pressure at $80k.
The support reversal could bolster the BTC buyers to rechallenge the recently breached support trendline at $87,000. The ascending support trendline has been intact since October 2023, offering buyers the key accumulation zone to recoup the bullish momentum.
Thus, the recent breakdown signals another win for sellers as they accumulate another resistance point in their favor to bolster the bearish momentum. If the price holds below the ascending trendline, Bitcoin could plunge to the next significant level of $74,220.
If the price managed to reclaim the aforementioned support, the buyer could strengthen their grip over the asset for renewed recovery.


