


SOL, the native cryptocurrency of the Solana ecosystem, plunged over 8% during Wednesday’s U.S. market session. This selling pressure aligned with a broader market pullback as the majority of major digital assets entered a post-rally correction. However, the Solana price shows strong resilience above $189, as on-chain data highlights a substantial supply pressure of holders defending this level. The daily chart pattern further emphasizes this level as a high area of interest for potential reversal.
Solana UTXO Data Shows Critical Support Levelss
Over the past week, the Solana price showed a high momentum rally from $157.23 to a recent high of $206.30, registering a 31.2% gain. However, the recovery witnessed a notable price pullback of over 8% during Wednesday’s market session to currently trade at $189.50.
While the broader market sentiment signals potential for a prolonged downtrend, the on-chain data highlighted the $189 and $177 as two crucial support zones for buyers. According to UTXO Realized Price Distribution (URPD) data, the $189 holds a substantial concentration of 10,987,276.48 SOL, representing 1.85% of the total supply.
In addition, the $177 level holds an even higher concentration of 40,937,048.608 SOL, showing 6.84% of the total.
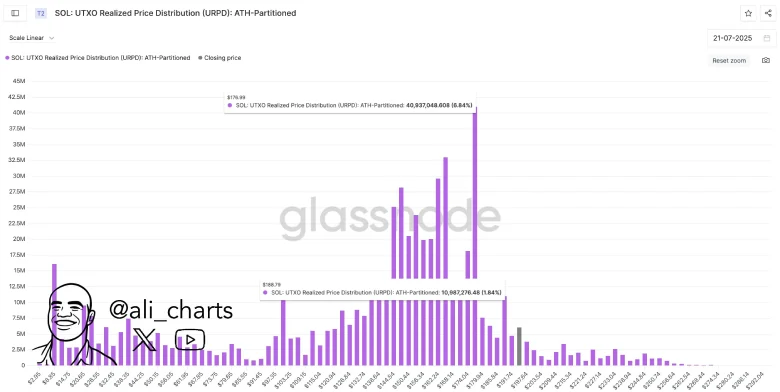
Thus, the aforementioned level stands as a crucial demand zone for coin buyers.supply.
SOL Price Correction Tests Major Support
Solana analysis of the daily chart shows the recent market sell-off pushed the price to around $188.5, a level coinciding with a cup and handle pattern. The chart pattern is commonly spotted at major market bottoms, as a U-shaped reversal indicates a major accumulation, and the pullback as a handle assist is followed by the handle portion to recuperate the exhausted bullish momentum.
On July 21st, the coin price gave a decisive breakout from the neckline resistance as a signal for a change in market dynamics. A recent golden crossover between the 50- and 200-day exponential moving average further reinforces the bullish sentiment in the market.
If the price holds above the neckline support, the post-breakout rally could drive a 46% jump to hit the $280 mark.

On the contrary, if the price retest dives below the neckline support, the sellers could strengthen their grip over this asset for a renewed correction trend.
Also Read: CoinShares Secures MiCA Licensing, Boosting Crypto Offerings in Europe.
